Working Capital - theory and practice featuring SAP's intelligent working capital insights application
project
by Alexander Roan on 2 Sep 2025
Introduction
Recently, SAP introduced the 'Working Capital Intelligent Insights Application' as part of SAP Business Data Cloud (BDC).
This is the first in a series of BDC-powered intelligent apps.
I like this app and its underlying architecture. Positives:
- It brings together working capital KPIs, trends, related KPIs, and details. This is important, as similar working capital results can hide differing realities.
- As part of BDC, the app can provide cross-entity, geography, and system results.
- Data is sourced from line of business solutions like S/4HANA using data products, which require less management than traditional reporting interfaces.
BDC also includes Datasphere and Databricks, which together make it possible to build on the SAP-delivered apps with:
- Data engineering
- AI/ML
- Advanced analytics.
But what is working capital? And how well does this app represent it? In this article I'll take a look at working capital theory and the new SAP reporting.
What is working capital
Working capital is a measure of financial resources that are available to an organisation in the short term.
Working capital can refer to the specific KPI 'Net Working Capital (NWC)'. Or, it may be used in a more general sense to refer to the factors that influence the calculation of the KPI.
The analysis and interpretation of working capital is complex:
- It summarises: inventory, payables, receivables, and cash
- A 'normal' NWC my hide unexpected underlying factors
- Expected results vary by industry, and operating environment
- It's a point in time measure, any delay in preparing it reduces its validity.
Financial definition of working capital
In this definition, 'available resources' and 'short term' have specific meanings:
Available resources:
- The total of assets minus liabilities
- (Everything a company owns minus everything is owes others)
Short term:
- Convertible to cash within 1 year
Assets and liabilities are recorded on an organisation's balance sheet. It's important to keep in mind the balance sheet is a point in time snapshot. It provides a valued list of the items a company owns and owes at a specified point in time. This list is constantly changing.
The high level structure of the balance sheet is:
- Non-current assets
- Current assets (short term)
- Non-current liabilities
- Current liabilities (short term)
- Shareholder equity (retained earnings and shareholder funds)
It's called the balance sheet, as these items balance according to the accounting equation:
Assets = liabilities + equity
To understand working capital, let's look into the detail of the current items:
Current assets:
- Inventories (raw material, work-in-progress, finished goods)
- Prepayments and other short term assets
- Trade and other receivables (accounts receivable)
- Derivative financial instruments (notes receivable)
- Other short term financial assets (notes receivable)
- Cash and cash equivalent
- Other e.g. deferred tax.
Current liabilities:
- Provisions (unearned revenue)
- Pension and other employee obligations (wages payable)
- Borrowings (current portion of long term debt)
- Lease liabilities
- Trade and other payables (accounts payable)
- Accrued tax payable
- Dividend payable.
It's a long list, and some items are a complex. But, usually, only a few lines drive the majority of working capital. These are the points we want to focus on:
- Cash (asset)
- Accounts receivable (asset)
- Inventory (asset)
- Accounts payable (liability).
So Net Working Capital primarily captures Cash, AP, AR, and inventory at a point in time.
In other words, the KPI tells us something about the organisation's primary operations. Let's look at how these factor into operations.
Business operation flow
Manufacturing is a good place to start. Cash, AP, AR, and inventory are all present.
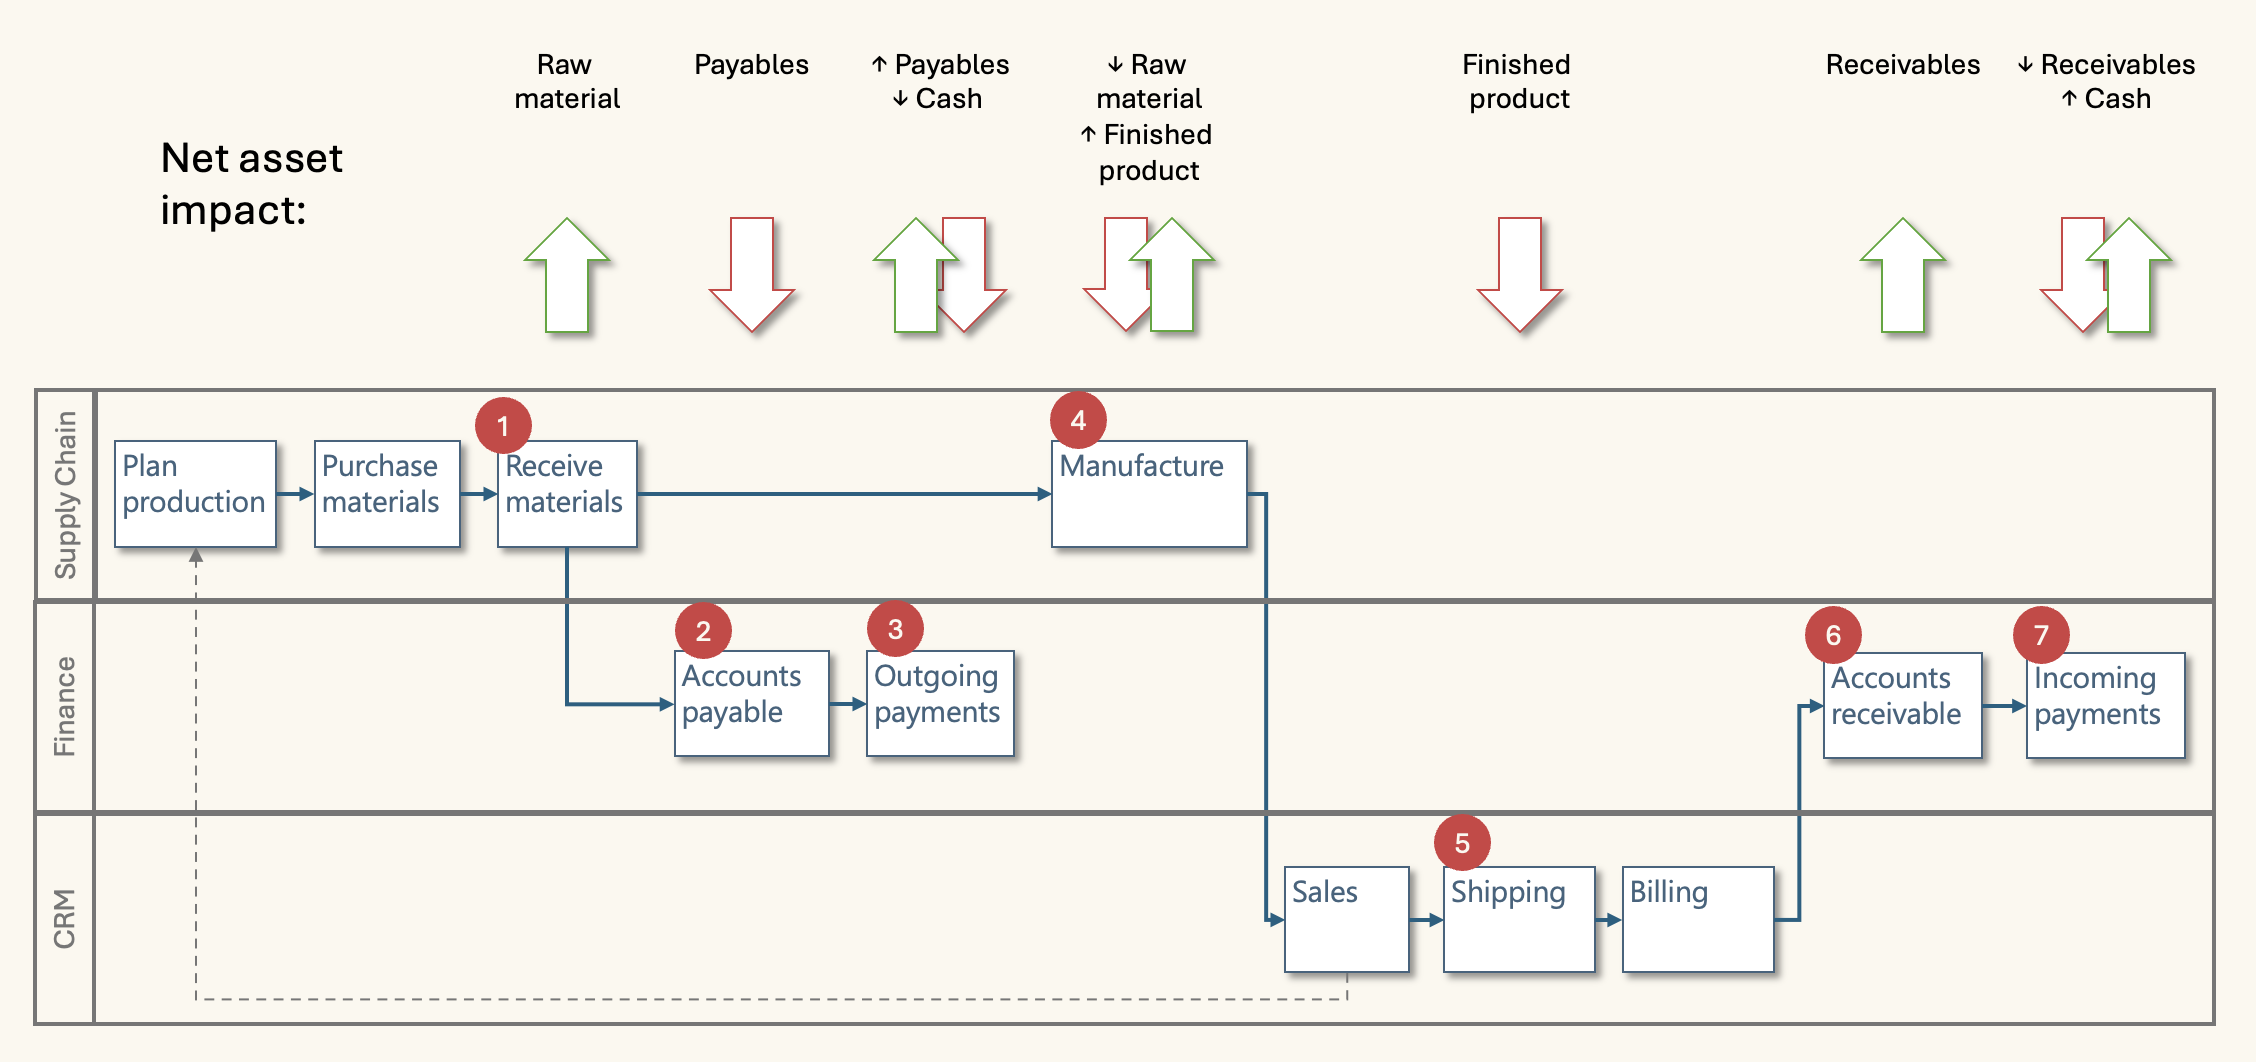
The diagram shows the flow of operations. Several steps have an impact on the balance of assets and liabilities:
- Receiving materials:
- Raw materials are considered convertible to cash within 1 year
- These are recorded as current assets when received
- Accounts payable
- An invoice arrives with a future due date for payment
- An invoice represents money owed to a supplier within 1 year
- Outgoing payments
- The invoice is paid when it's due
- Cash is reduced when the payment is sent to the supplier
- The open invoice is cleared and money is no longer owed
- Manufacturing
- Raw materials (RM) are removed from inventory (RM asset reduction)
- During production, work in progress is recorded (WIP asset increase)
- After production, finished products (FP) are added to inventory
- (FP asset increase, WIP asset reduction)
- Overall, a net asset increase as FP value is higher than RM value
- Shipping
- Finished products are sent to the customer (FP asset decrease)
- Accounts receivable
- An invoice is sent to the customer
- This invoice represents money the customer owes us within 1 year
- Incoming payments
- An incoming payment is received from a customer
- This increases cash
- This clears the open customer invoice.
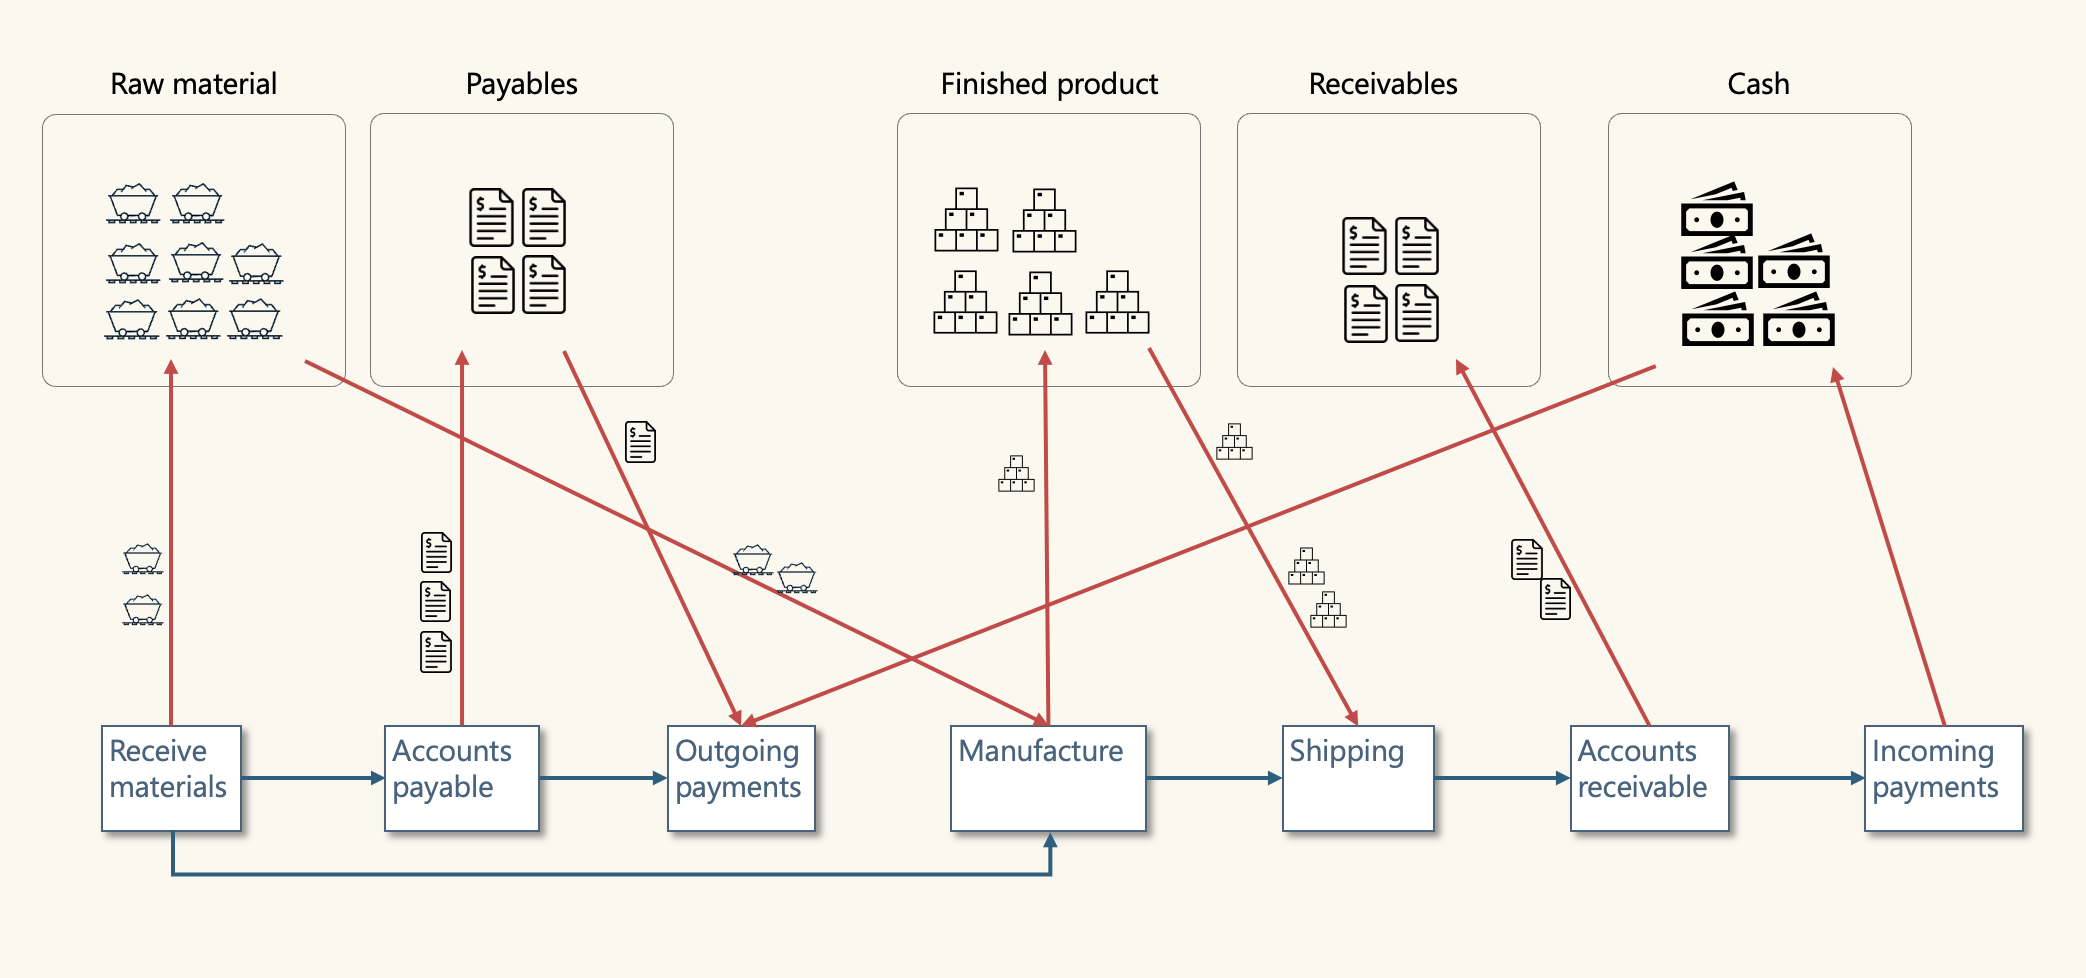
When thinking about the flow of operations and working capital, I'd suggest to keep in mind two key concepts; continual change, and timing.
Key Concepts - Continual Change
I tend to imagine a single item flowing through operations. However, in reality working capital never measures a single item, it measures a point in time with a mix of in-progress items.
Most manufacturing organisations operate on a 'make to stock' basis. Sales are made from stock. Stock is replenished through manufacturing based on forecast/planning.
Depending on when you capture a snapshot of the balance sheet, the levels of cash/AP/AR/inventory can vary significantly.
Consider a big order shipment, or a big cash receipt. These will cause a shift in working capital from one moment to the next.
A better abstraction may be something like this:
Key concepts - Timing
Accounts Receivable and Accounts Payable represent sales and purchases made on credit. Total sales equals cash sales plus accounts receivable.
These credit sales and purchases involve negotiated payment terms. This introduces a timing factor to working capital.
If a manufacturing company operates on a make to stock basis, their inventory levels represent another timing factor. Inventory at minimum should cover the time it takes to buy raw materials and manufacture a product.
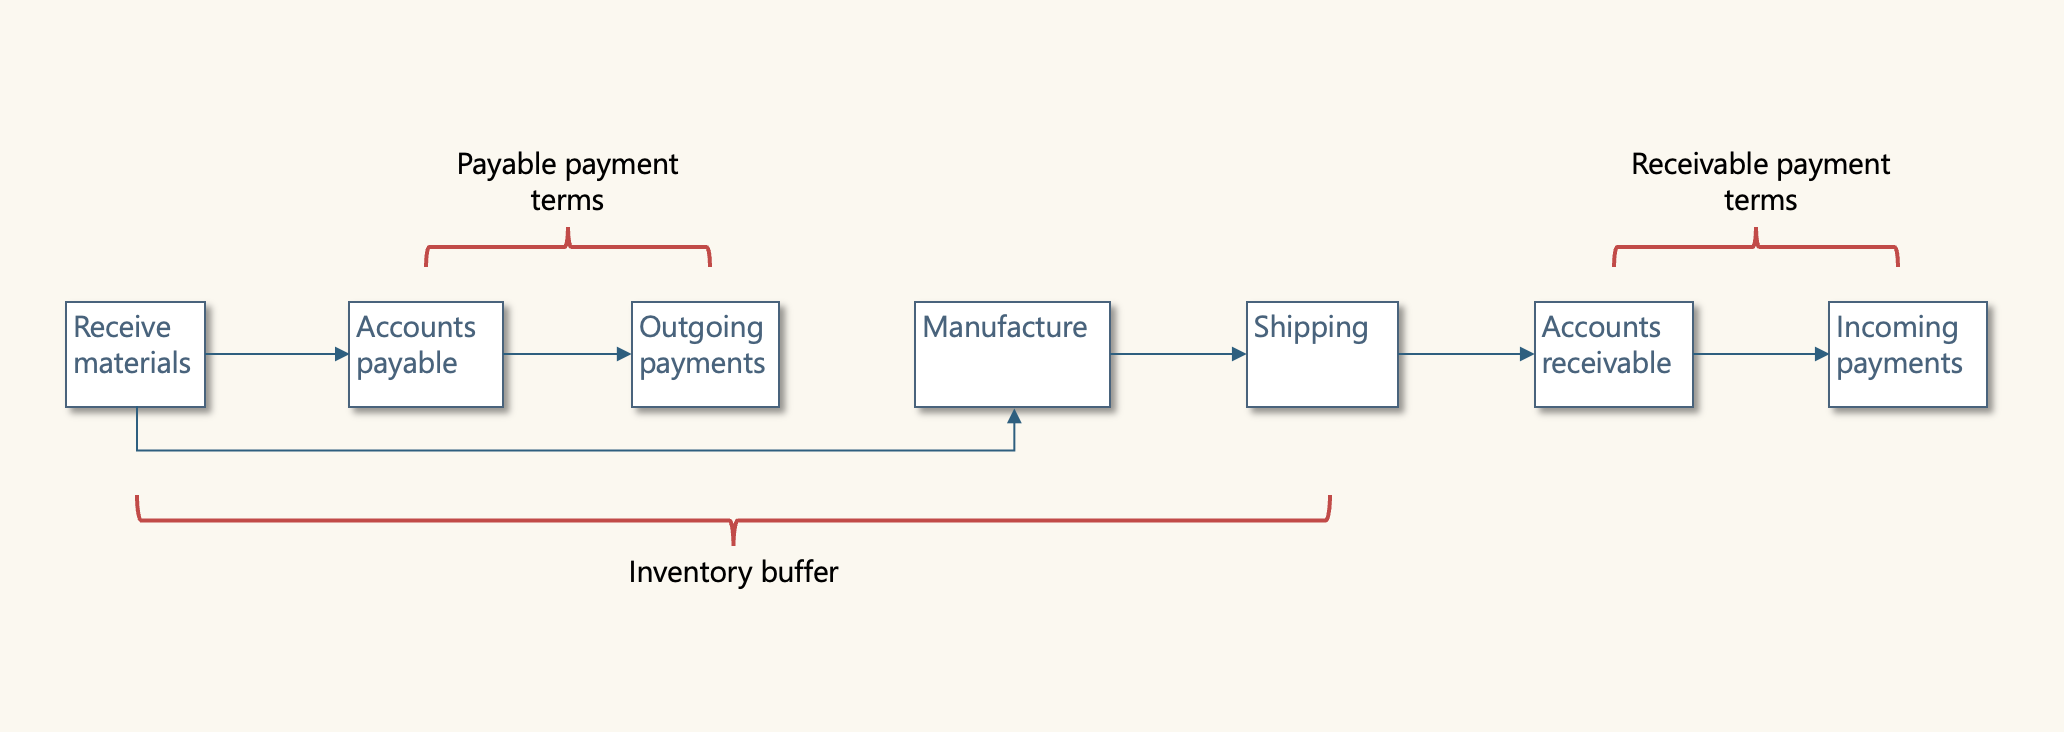
To illustrate timing:
- A company receives an order for finished product from a customer
- They ship from stock, and send an invoice
- Accounts receivable is due for payment in 60 days
- Raw materials are continuously being ordered to manufacture more stock
- Raw materials arrive together with an invoice
- The invoice is due for payment in 30 days.
In this example, the difference between A/R and A/P payment terms means the organisation has a 30-day window where it needs to fund raw materials with its own cash.
In 'make to stock' the individual sale and shipment is not linked to raw material procurement. But, the total bucket of all sales, all shipments, all inventory, all purchasing are linked in this timing.
If total A/R and total A/P terms are poorly aligned, companies need a lot more cash to fund operations.
An idea scenario is to run a 'make-to-order' business. If a customer's advance payment or down payment covers procurement and manufacturing costs, this puts a business in an excellent cash position.
I was curious about Tesla when I read customers were putting deposits down one year in advance for the Cybertruck. Next, let's look at Tesla's financial data.
Case study: Tesla
Yahoo Finance is a good resource for financial summaries - Tesla on Yahoo Finance.
On 31/12/2024:
- Current assets = 58.4bn
- Current liabilities = 28.8bn
- Net working capital (NWC) = current assets - current liabilities = 29bn.
This is a massive amount of positive working capital.
However, at this level of detail, it is difficult to draw more detailed conclusions.
Let's look at Tesla's US SEC filling to get more insights - SEC filing. This includes data for June '25 and December '24.
Current assets on 31/12/2024:
- Current assets = 58.4bn
- Cash, cash equivalent and short term investments = A whopping 36.6bn
- A/R = 4.4bn
- Inventory = 12.0bn.
I knew Tesla were cash rich, but I was still slightly shocked to see the number This asset mix may indicate:
- High cash, which enables:
- Flexibility to invest
- Flexibility to build stock if needed
- Flexibility to design and launch new products
- Low A/R, which could indicate:
- Payments are collected upfront (via deposits)
- When sales are on credit, there is little to no problem collecting cash.
But, what about the Tesla taking deposits far in advance. Let's look at the liabilities.
Current liabilities on 31/12/2024:
- Current liabilities = 28.8bn
- A/P = 12.5bn
- Accrued liabilities and others = 10.8bn
- Deferred revenue = 3.2bn
- Current portion of debt/finance = 2.5bn
We can see deferred revenue of 3.2bn, some of which may related to advance payment for vehicles. Keep in mind, these numbers are Tesla wide.
Accrued liabilities of 10.8bn also includes customer deposits of 1bn.
So, around 4.2bn of advance payments from customers. Unfortunately, we don't know the exact nature of these, nor the product they relate to.
However, we do see total inventory of 12.0bn. Customer advance payments of 4.2bn covers 1/3 of inventory.
So 1/3 of inventory is financed by customer advance payments.
From the above, I also note AP aligns well with inventory (12.0B, and 12.5B). This suggests Tesla aligns purchases with production needs well, minimizing excess stock. This would indicate a high level of procurement efficiency.
I'd conclude that:
- Tesla are extremely cash rich
- They have a lot of flexibility to invest, innovate, build stock, etc.
- No notable working capital issues
- No sign of difficulties recovering cash, or selling stock
- Advance payments cover a sizeable part of their purchasing / inventory.
Variations by organisation
Working capital differs by various factors. Three big ones are:
- Industry
- Company size
- Risk profile
Manufacturing was a good place to start, but let's look at how it differs for services and retail.
Service Industries
Generally, services don't have inventory or trade accounts payable.
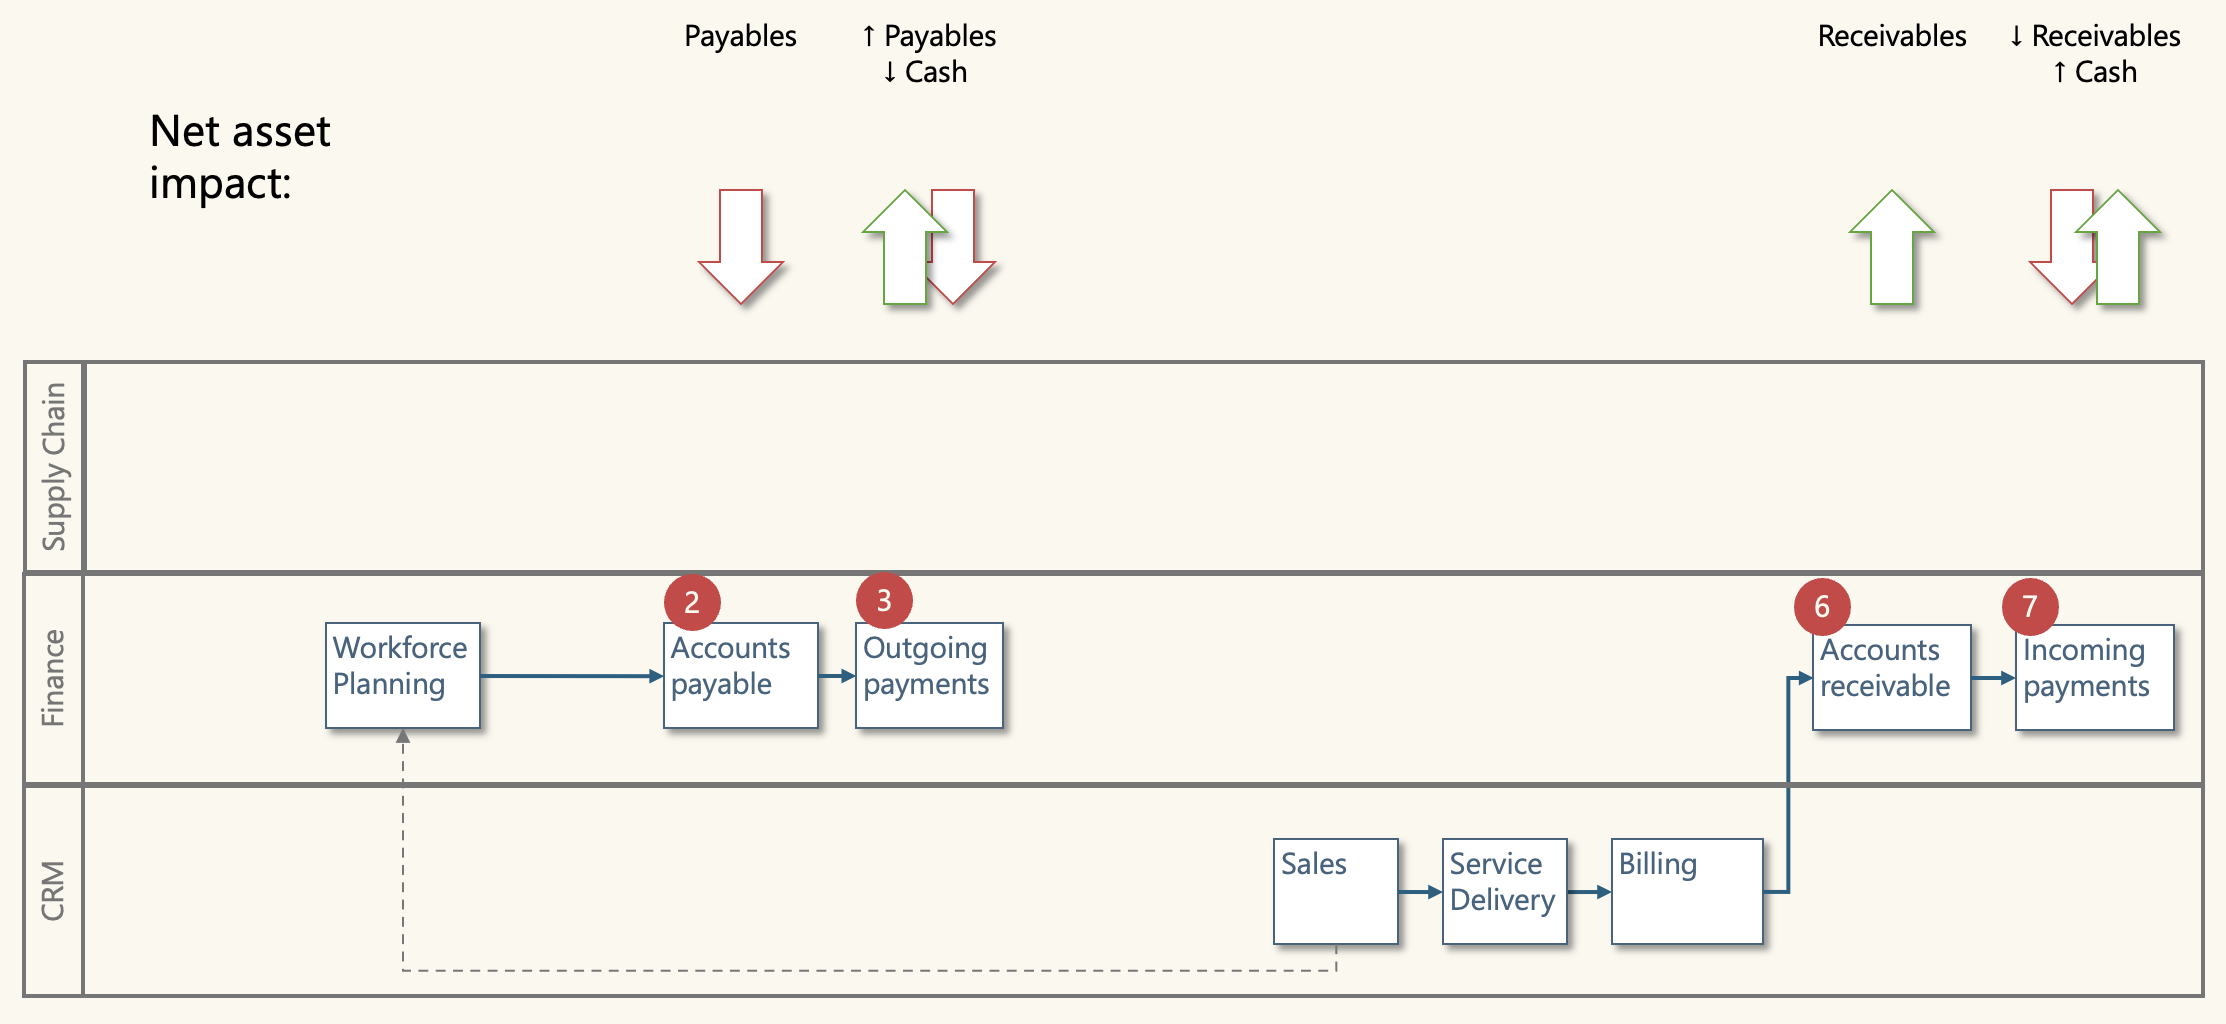
However, working capital can still be a relevant measure. Consider a consulting firm or a systems integrator.
Current assets:
- Accounts receivable
- Billing is usually based on service delivery milestones
- Inventory
- They may consider 'time booking' on projects as a contract delivery asset
Current liabilities:
- Accounts payable: cost of staff, contractors, software, etc.
Creating a services industry customised version of working capital can help them monitor their cash, receivables, 'service WIP inventory', and costs.
The big considerations for services are:
- Unbilled revenue is “hidden AR”
- Utilisation, milestone cadence, and acceptance criteria drive the cycle
- Prepayments reduce NWC but add performance obligations.
Retail Industries
Generally, retail doesn't have Accounts Receivable, sales are cash. They don't have manufacturing, but they do hold stock in inventory.
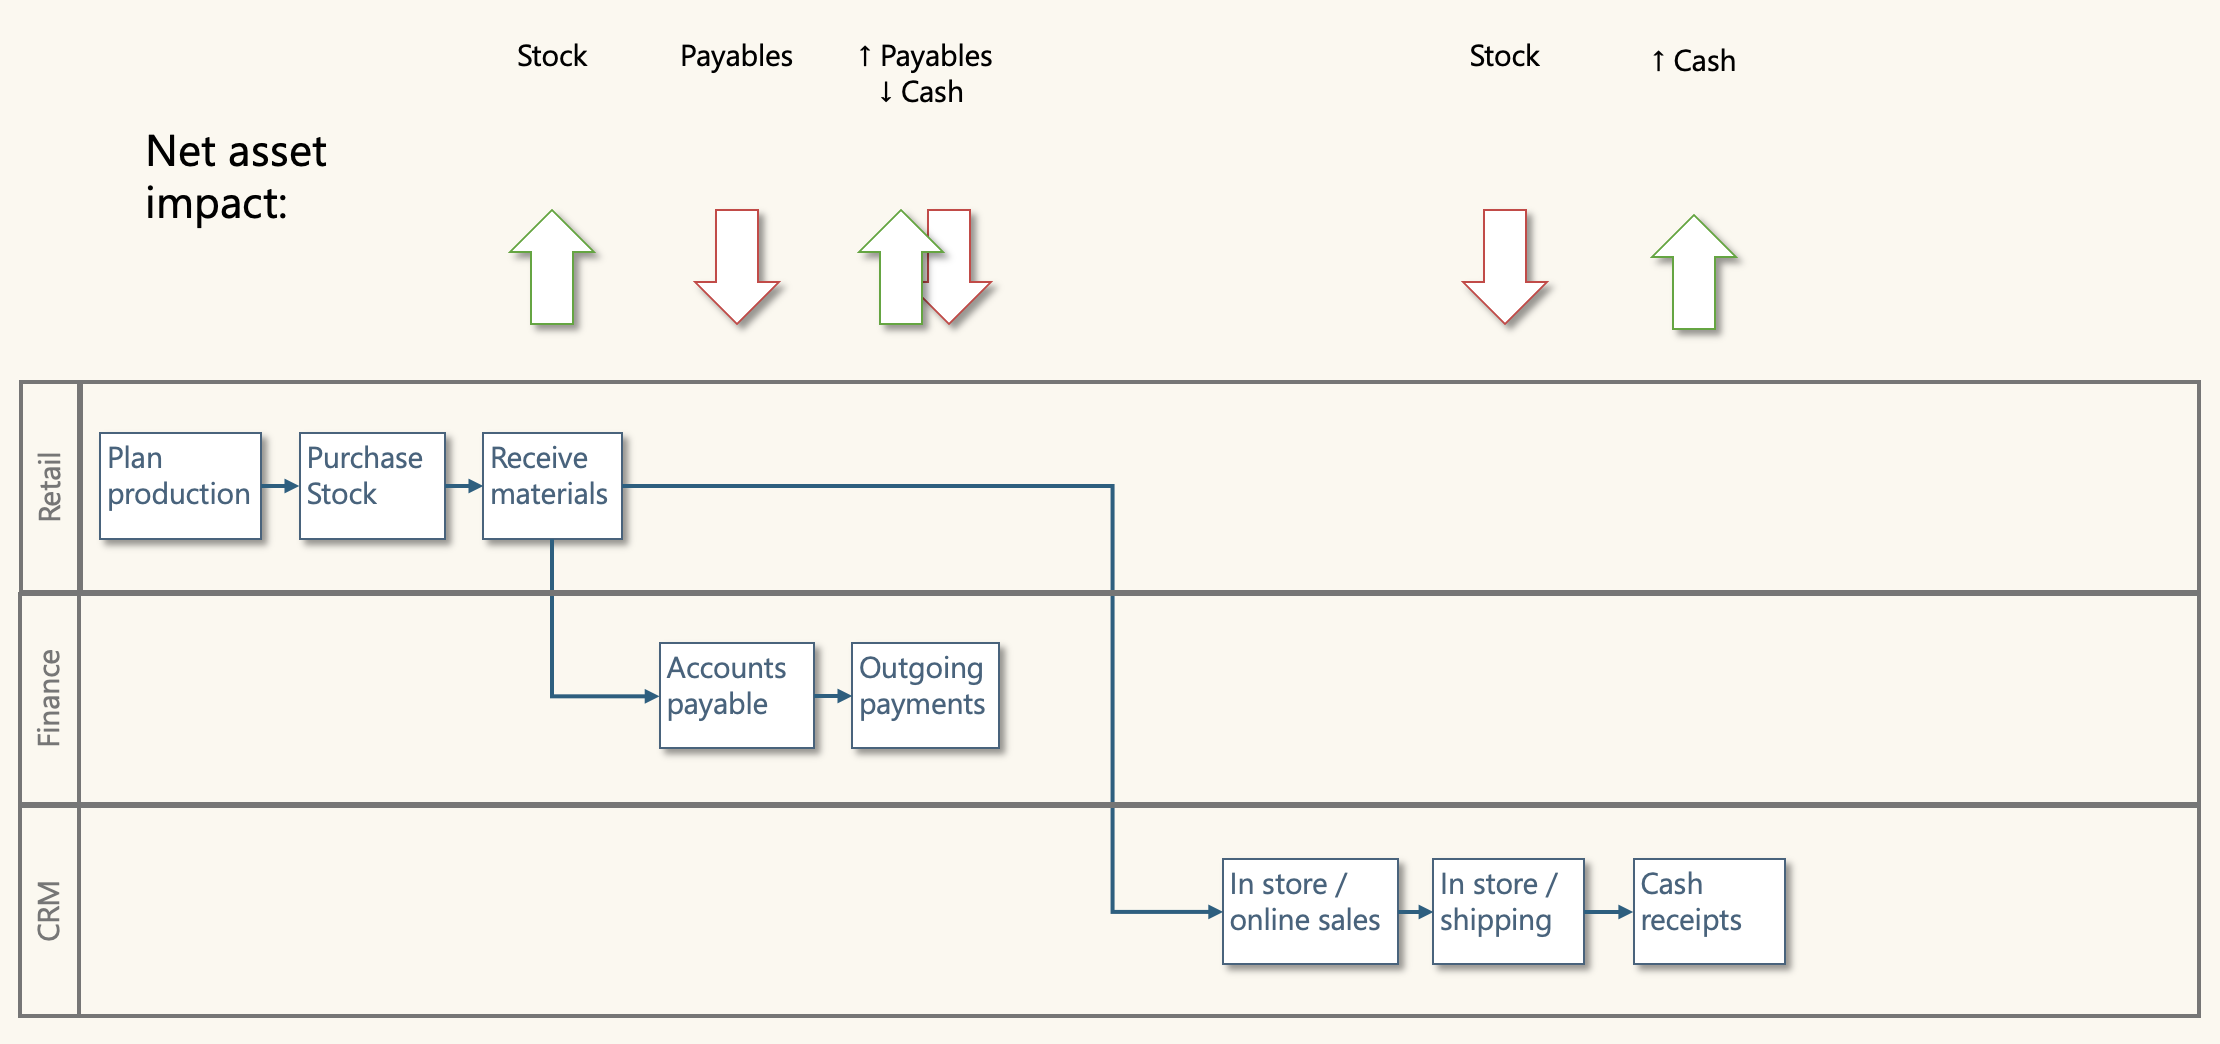
The rough flow in retail:
- Stock is purchased
- Stock is received
- Increase inventory (asset increase)
- Increase A/P (liability increase)
- Stock is paid for
- Decrease A/P (liability reduction)
- Decrease cash (asset reduction)
- Customers buy stock in-store, paying at cash registers
- Decrease inventory (asset decrease)
- Increase cash (asset increase)
The process is similar for online stores, just replacing in-store collection with shipping.
In retail, the size of the business and the nature of the stock has a big effect on working capital.
A large retail chain with fast moving stock sells for cash and buys on credit. They may be able to sell stock before they pay for it. When large retailers negotiate long AP payment terms, this puts them in an excellent cash position.
Small, specialist retailers on the flip side may have some inventory items that they buy, and remain in stock for a long time. This ties up cash.
In retail, inventory and supplier terms are a key focus. Other factors to keep an eye on include returns liability, and gift cards (deferred revenue).
Balance sheet items in detail
Accounts Receivable (AR)
Accounts receivable tracks sales made on credit to customers with a due date for payment in the future.
An A/R invoice is usually issued at the point of product or service delivery. This invoice includes the agreed payment terms.
Payment terms include two main factors:
- Length of time before the payment is due
- Discounts for early payment if relevant
A simple payment term is '60 days net due', or with a discount '60 days net due or 15 days 2% discount'.
From a working capital perspective, organisation's want to ensure customers can pay, and that they pay as quickly as possible.
A wide range of AR factors impact working capital, these include:
- Credit policy
- Who is credit advanced to, on what terms
- What is the risk of non-payment or late payment
- Dunning processes
- Utilisation of reminders and follow with customers on open invoices
- Early identification and resolution of disputes
- Extent of and maturity of discounting
- For example, adjusting discounting based on working capital forecast
- Invoicing efficiency
- Issuing invoices on-time, technology such as e-invoicing to automate
- Payment receipts efficiency
- Providing a range of payment options
- Efficiency at matching incoming payments to open invoices.
Accounts Payable (AR)
Accounts payable tracks purchased made on credit from suppliers with a due date for payment in the future.
An A/P invoice is usually received at the point of goods or service receipt.
For working capital, look at a subset of total A/P. The part that relates to products or services.
Payment terms also apply to AP.
AP factors that affect working capital include:
- Payment terms
- Utilisation of supplier owned inventory (only purchased on consumption)
- Efficiency of the purchasing-receiving-invoicing cycle, lots of metrics including:
- Invoice right first time rates
- 3-way match cycle time.
Inventory
Inventory levels are an important consideration for working capital. Holding high inventory levels requires a large AP spend, and that cash remains tied up in inventory until it's sold.
Optimising inventory is a challenging topic. Manufacturing plans are usually based on sales plans, which are based on actual sales. However, this is not an exact science and planning beyond the very near future is extremely difficult.
On the one hand, we want to minimise inventory to release cash. On the other hand, we may want extra inventory as safety stock as a buffer for unexpected events.
Key inventory factors to consider related to working capital
- Forecast accuracy
- Safety-stock policy
- Lead-time compression
- Stop keeping unit rationalisation (number of products/product variations)
- Vendor managed inventory / consignment stock
- Postponement.
Cash
Optimising inventory, AP, and AR can make more cash available. Cash is also affected by various other factors, key cash considerations include:
- Utilisation/reliance on short term loans
- Spending requirements:
- Procurement related to product/service delivery
- Spending on capital projects
- Spending on R&D and product development
- Ability to invest in building stock to meet specific demand spikes.
Other balance sheet items
Working capital may include other current items:
Current assets
- Prepayments and other short term assets
- Derivative financial instruments (notes receivable)
- Other short term financial assets (notes receivable)
- Other e.g. deferred tax
Current liabilities
- Provisions (unearned revenue)
- Pension and other employee obligations (wages payable)
- Borrowings (current portion of long term debt)
- Lease liabilities
- Accrued tax payable
- Dividend payable
These are usually smaller components. When analysing a company, if one of these is a big factor, it should be investigated further.
Key performance indicators
When it comes to analysing working capital, I'd highlight five key performance indicators:
- Net working capital
- Days sales outstanding
- Days payables outstanding
- Days inventory
- Cash conversion cycle
I would supplement any analysis with a few connected KPIs:
- Current ratio
- Quick ratio
- Operational cash flow
In general, working capital KPIs are used as broader indicators of health:
- As an indicator of short term financial health
- A measure of how efficient operations are
- A measure of how well managed a business is.
Let's have a look at each KPI.
Net Working Capital (NWC)
Net Working Capital (NWC) = Current Assets − Current Liabilities
A common way to visualise NWC is to put assets and liabilities in stacked bar columns. The difference between the two columns equals working capital. Let's visualise the Tesla data we looked at earlier.
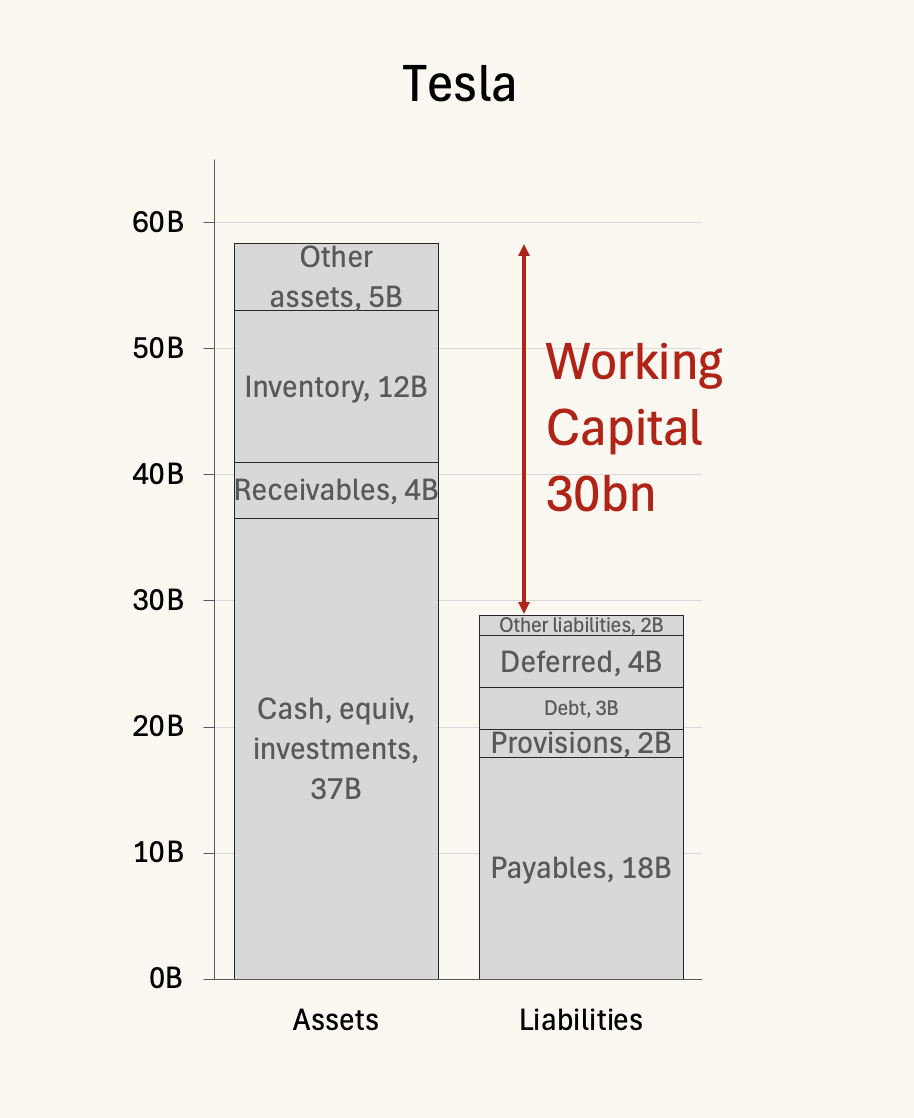
These charts are great. They make the nature of assets very clear. In the Tesla case not only do we see high working capital, we see most of it is highly liquid as cash, cash equivalents and short term investments.
Converting inventory and receivables into cash takes time, and actual realised value may be lower than the book value.
These charts also give a good indication of the relationship between Cash, Receivables, Inventory, and Payables.
High level interpretation guidelines for NWC include:
- Positive working capital may suggest:
- Good support for ongoing operations
- Ability to invest in growth
- But high positive working capital can hide issues:
- Excess inventory
- Slow AR
- Lack of strategy to manage / invest cash
- Under-utilization of low-cost debt
- Negative working capital may suggest liquidity issues:
- Growth
- Paying back debt
- Pending bankruptcy.
What if we compared Tesla with another automotive company? What if we compared those with consumer goods, retail, and services?
I've picked out Ford, Proctor and Gamble, Walmart, and Accenture as samples. Here are their working capital breakdowns side-by-side. All on the same scale apart from Walmart, which is comparatively much larger.
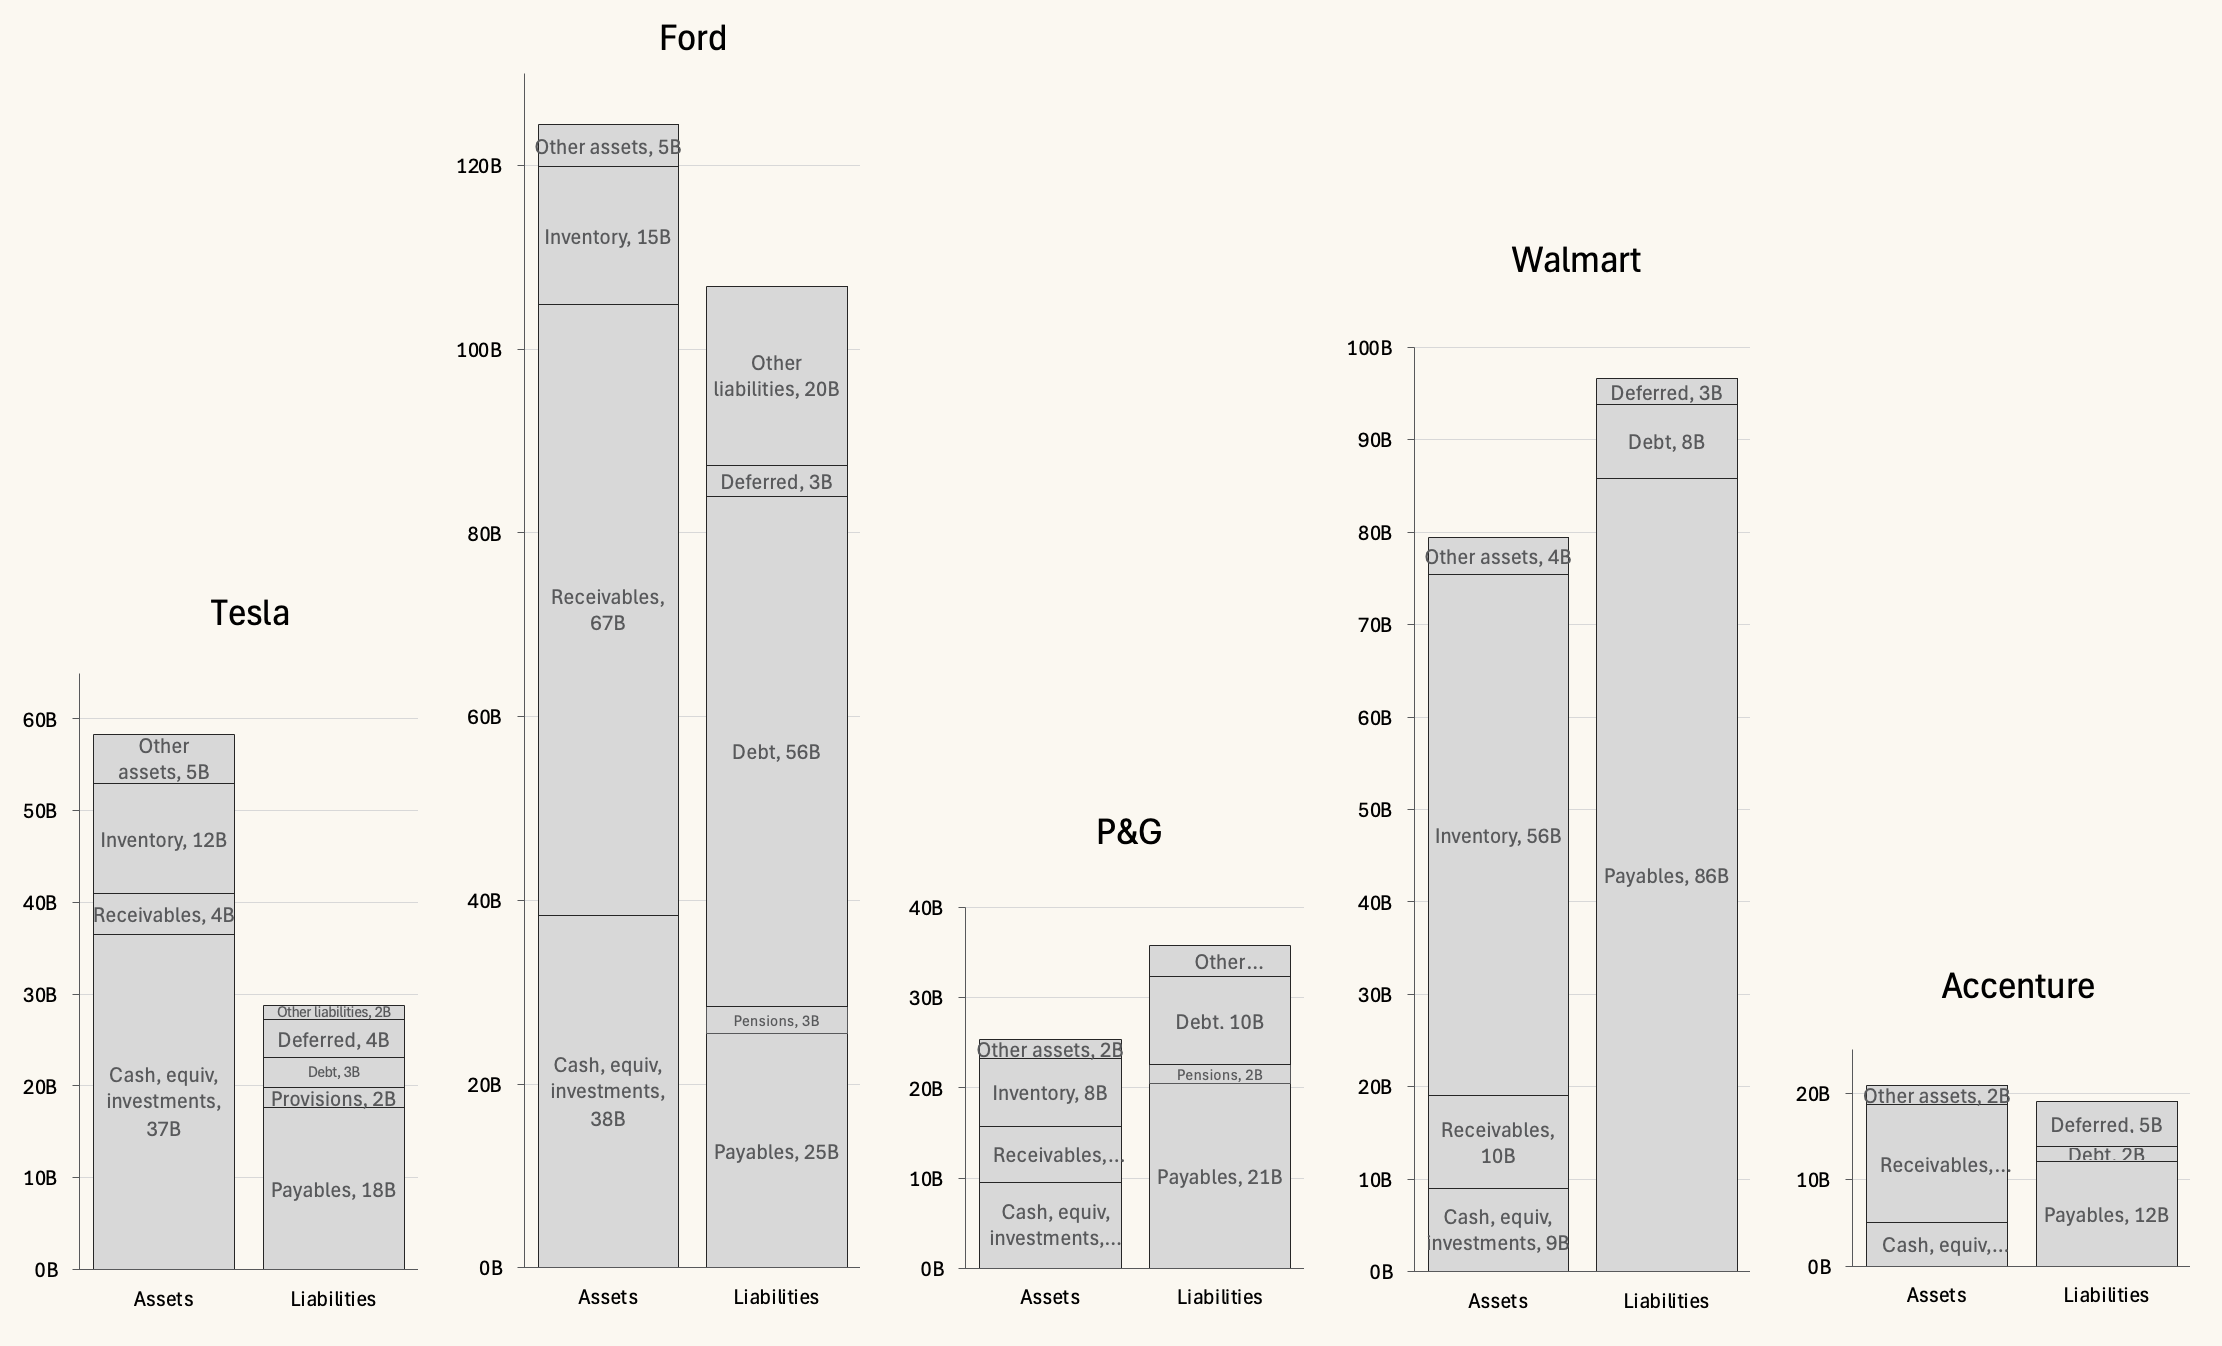
- Tesla is indeed cash rich, with high positive working capital
- This reflects a lean, and efficient operating structure
- Ford:
- A lot of cash driving positive working capital
- Notably huge A/R, huge debt
- (Capital intensive/credit-heavy business model)
- P&G:
- Significant negative working capital
- Driven by large open A/P and debt
- Common in FMCG, where suppliers finance operations
- Walmart:
- Significant negative working capital, driven by huge A/P
- Notable that A/P is greater than inventory + receivables
- Like FMCG, retailers commonly finance through suppliers
- Accenture:
- Small positive working capital
- Receivables only slightly higher than payables
- As expected, a light working capital structure in services.
As discussed, NWC is a point in time static metric. Despite all the detail above, we haven't gained any insight on how these assets and liabilities related to revenue or costs. The next three KPIs; DSO, DPO, and DIO blend balance sheet and P&L data to give us a more dynamic view.
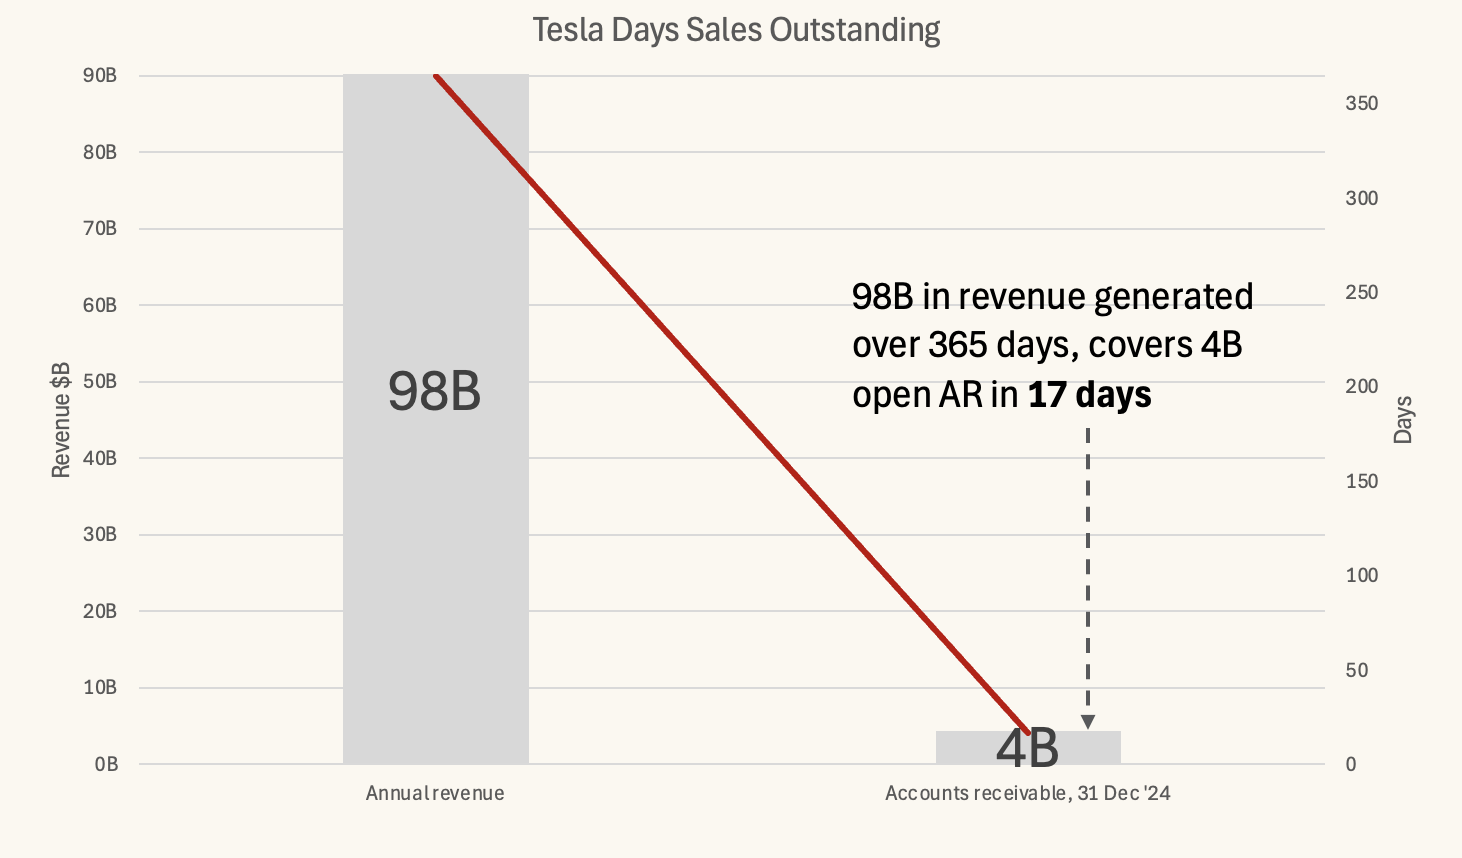
Days sales outstanding
DSO looks at the balance of open accounts receivable at a point of time in conjunction with revenue over a period of time (a year).
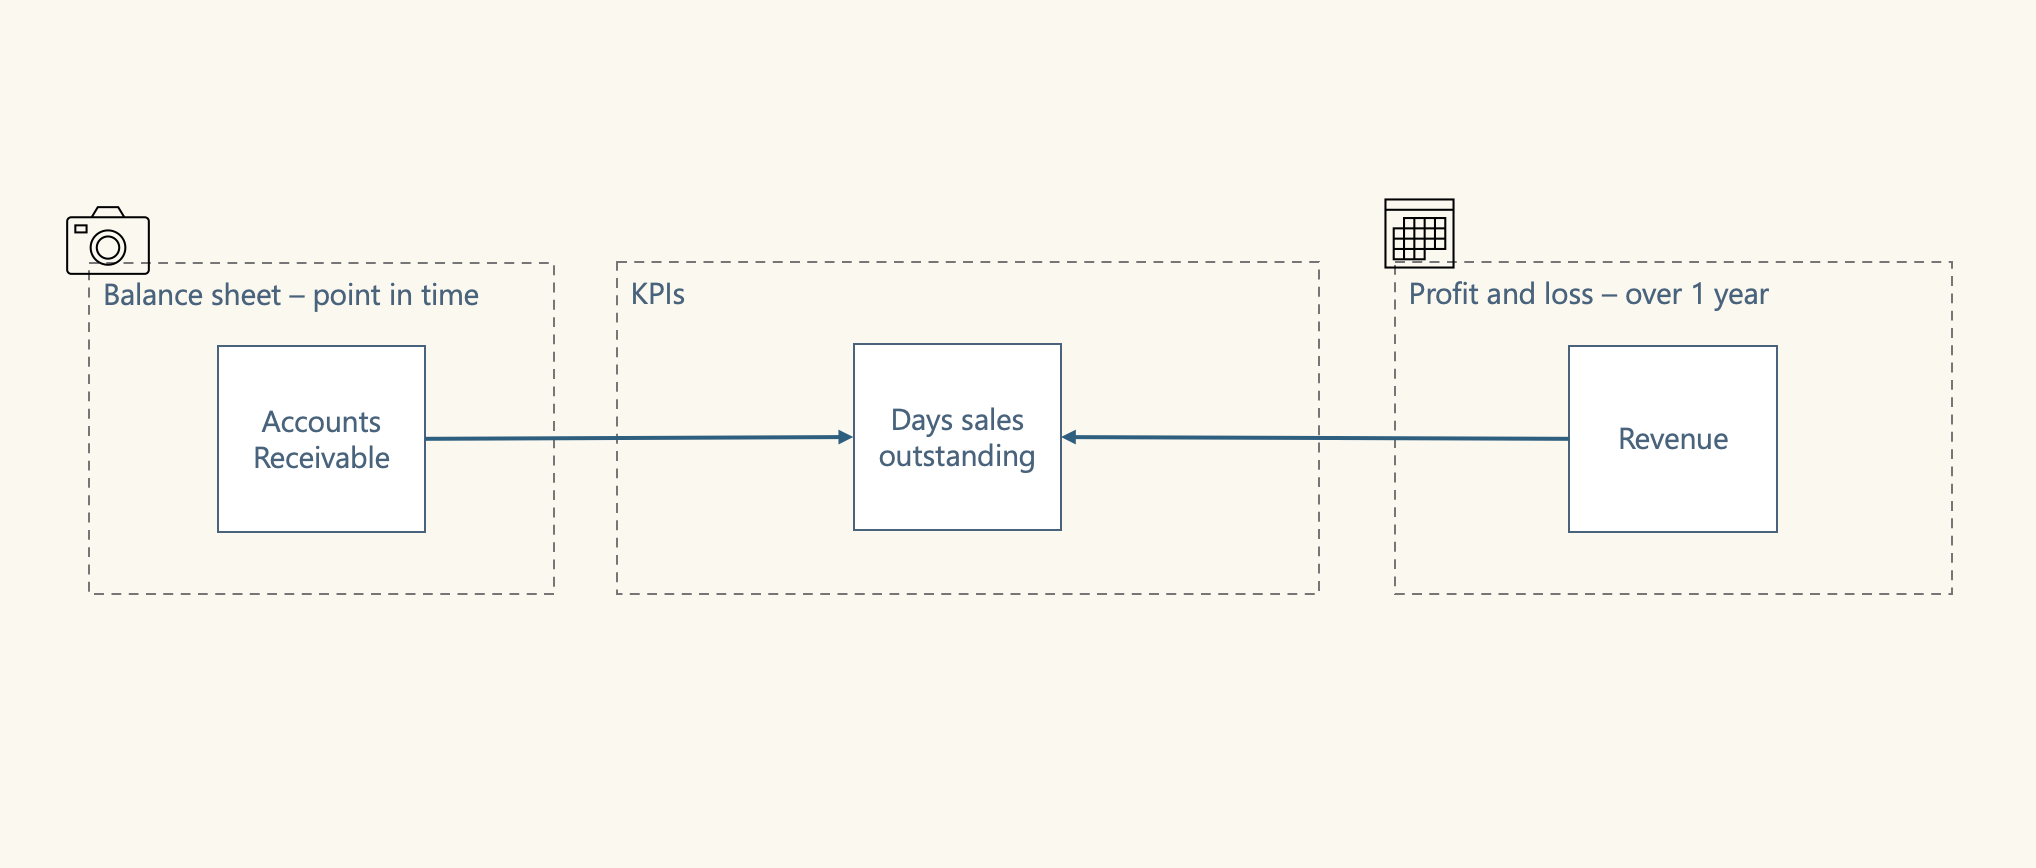
Going back to Tesla:
- Accounts Receivable at 31/12/24 = 4.42bn
- Revenue from 01/01/24 to 31/12/24 = 97.7bn
Their annual revenue clears their open AR around 22 times in a year! Or, put another way, it only takes 17 days of cash receipts for them to collect their full open AR balance.
To get to 17 days: Days Sales Outstanding (DSO) = (AR / Net revenue) * 365
Where:
- AR is net accounts receivable at a point in time
- Net Revenue = Gross Revenue – Returns – Discounts.
We can visualise this by plotting the revenue in relation to 365 days, and highlight how the 4bn receivables relates to 17 days.
Calculation notes:
- If AR fluctuates a lot or the business is highly seasonal:
- Use an average to avoid fluctuations (period end AR - period start AR) / 2
- Use rolling 3–6 month averages for seasonality
- Separate “current” vs. “overdue” AR to see impact of overdue on DSO
- Make sure to exclude:
- Provisions for doubtful debts
- VAT
Generally speaking, a low DSO is attractive. It indicates an organisation can convert credit sales to cash quickly. A high DSO may hint at collection issues.
Let's look at the comparison with the other companies:
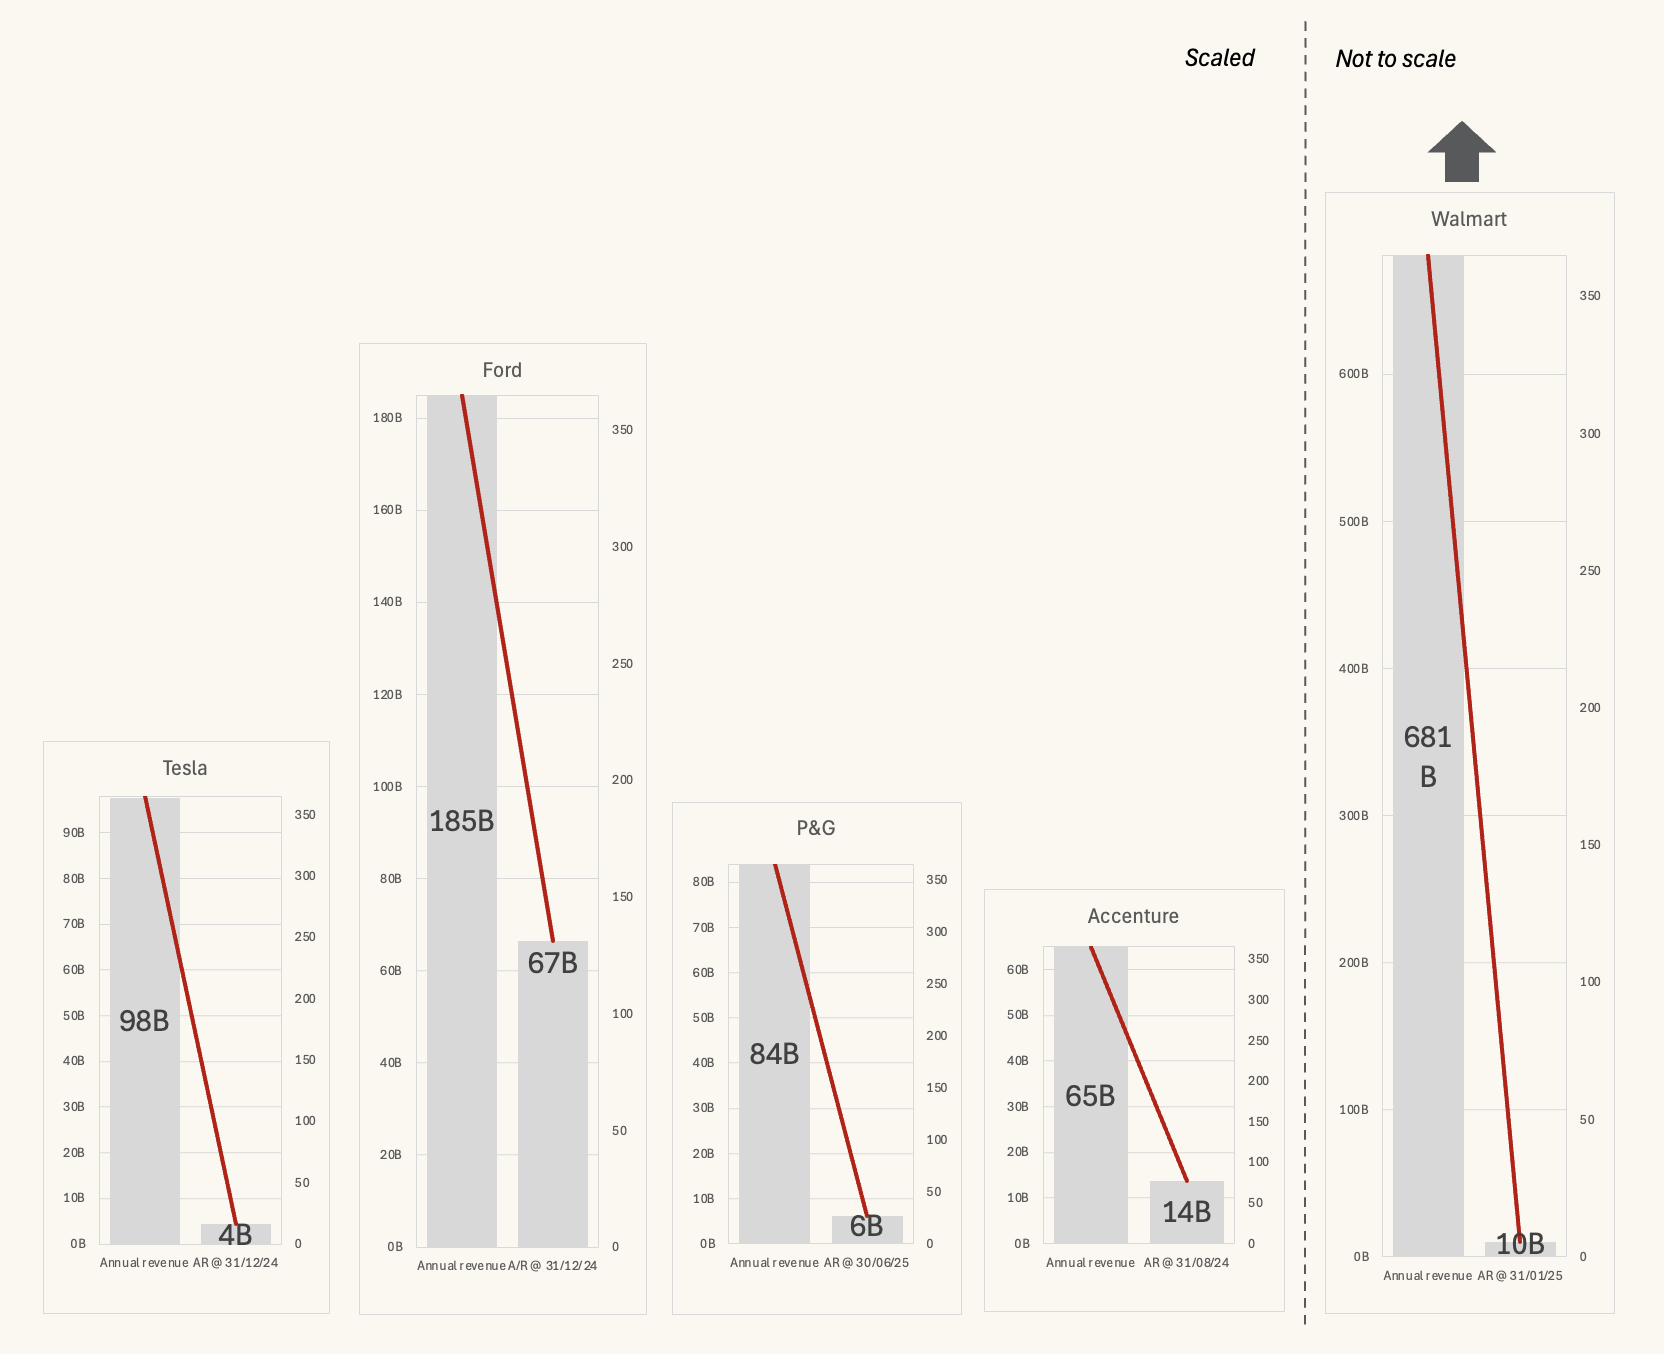
- As with NWC, Tesla's DSO performance is impressive
- Ford: 131 days
- Ford takes the longest out of this group to collect cash
- A reflection of their focus on selling on credit
- P&G: 27 days
- A strong number for FMCG where credit sales are normal
- Indicates P&G has solid credit policy and AR processes
- Walmart: 5 days
- Very short DSO, a reflection of retail being a cash sales business
- Accenture: 77 days
Interpretation
-
High DSO:
- It takes a long time to receive payment
- May indicate collection issues.
- In some cases, may represent high quality customers with strong buying power
-
Low DSO
- Cash sales over credit sales
- Efficient collection process
- Good cash flow.
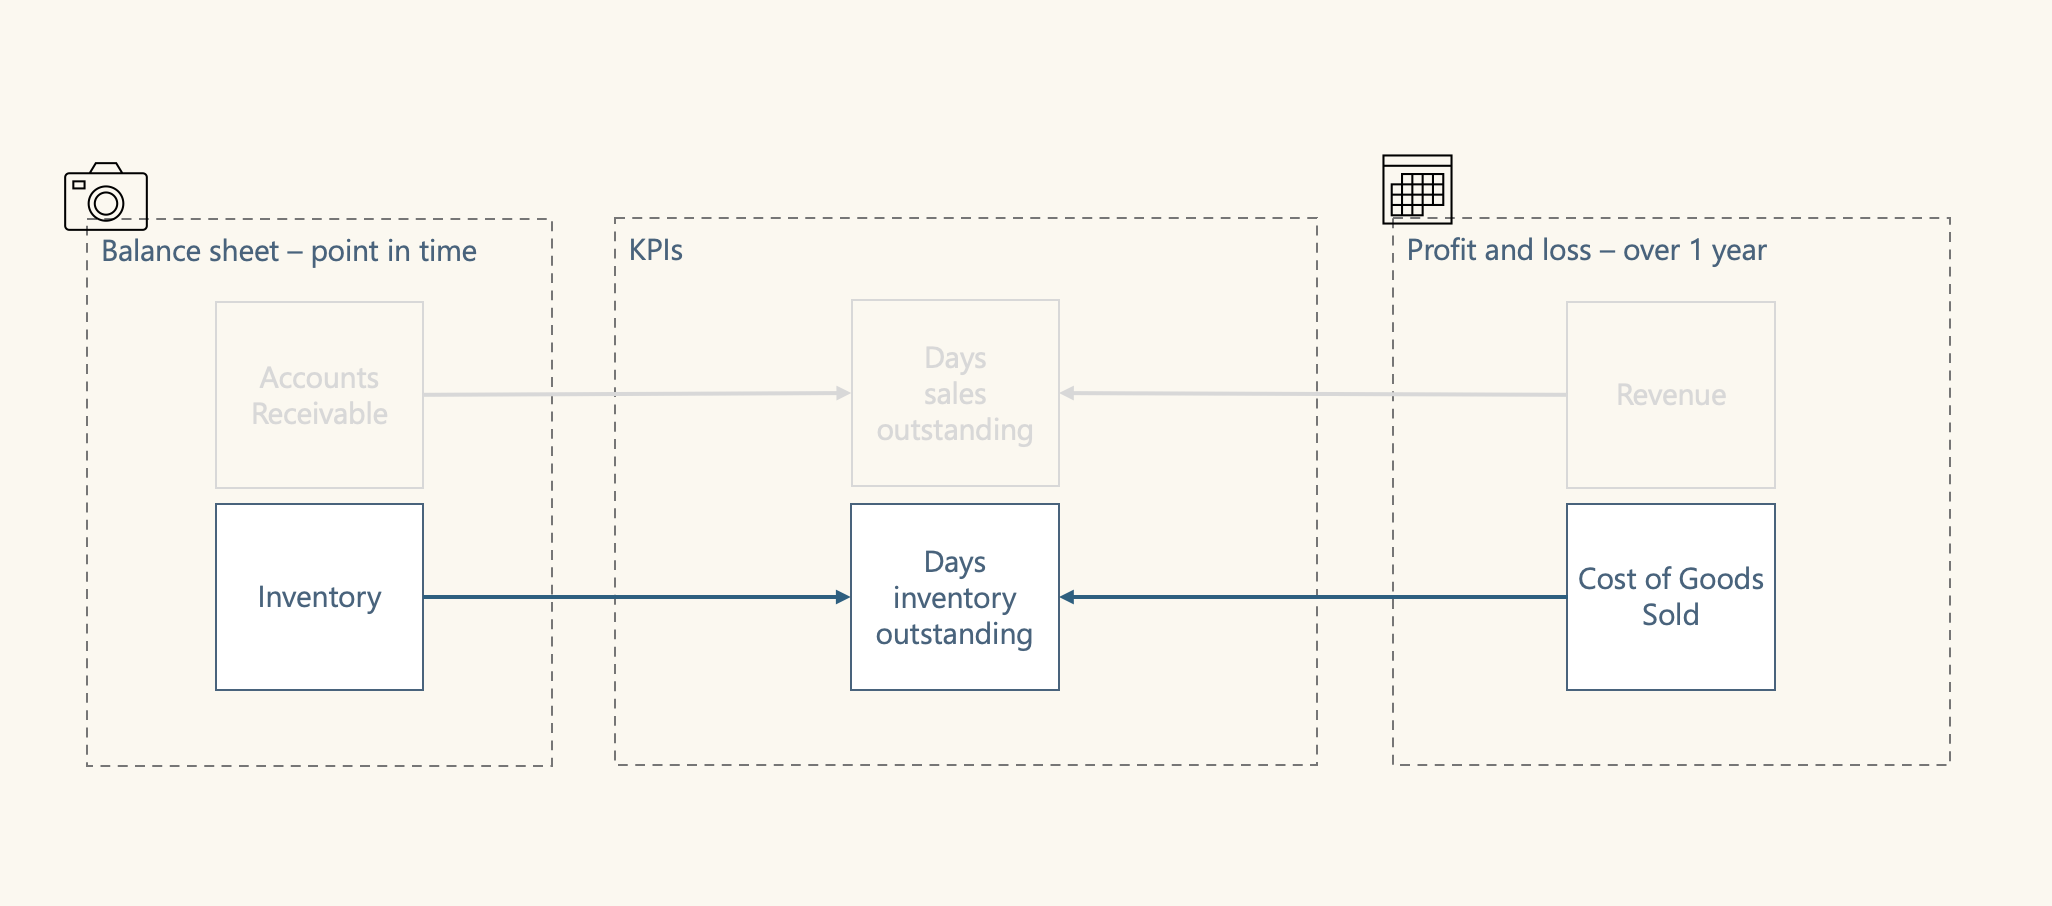
Days inventory outstanding
DIO looks at the balance of inventory at a point of time in conjunction with cost of sales over a period of time (a year).
Cost of sales are booked at the point of shipping and are the direct costs related to the creation of a product or service that is sold. It's the part of revenue that relates most closely to inventory.
Going back to Tesla:
- Inventory at 31/12/24: 12bn
- COS from 01/01/24 to 31/12/24: 80bn
COS covers inventory about 7 times a year. Or, put another way, it takes 55 days of COS to pay for current inventory.
To get to 55 days: DIO = (Inventory / Cost of sales) * 365
Where:
- Inventory on the balance sheet includes:
- Raw materials
- Work in progress
- Finished goods
- COS is mostly manufacturing and direct production costs
- Exclude non-trade items
Let's look at our comparison companies:
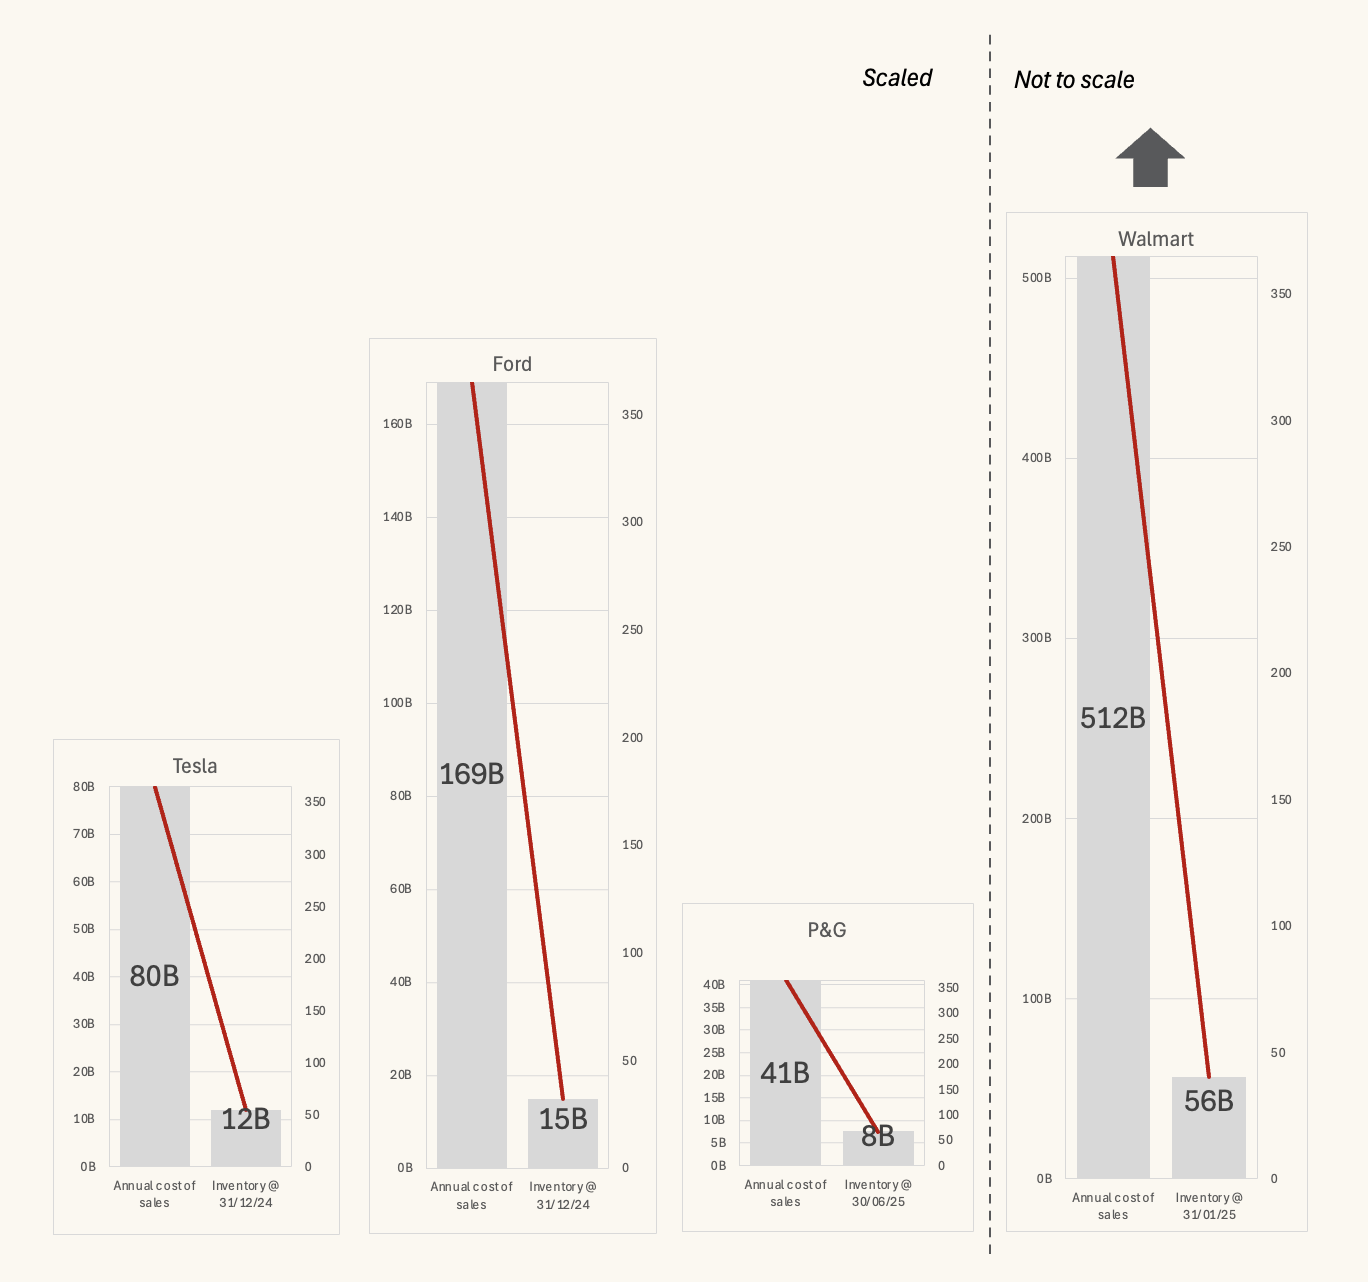
Tesla: 55 days Ford: 32 days P&G: 67 days Walmart: 40 days Accenture: No inventory / not relevant
Interpretation
-
High DIO:
- May indicate slow sales
- May indicate too much inventory (increased storage costs, risk of obsolete)
- May indicate lack of demand for product
-
Low DIO
- Good sales: inventory is sold quickly (a potential sign of efficiency)
- Less cash is tied up in inventory
- Organisations may struggle to react to extra demand
Where we see significant variation in NWC and DSO, the DIO looks a lot closer across these companies. When we look at inventory in relation to sales, Ford performs well, but as we've seen this is supported by a credit sales model which will help drive sales volume.
Days payables outstanding
DPO looks at the balance of AP at a point of time in conjunction with cost of sales over a period of time (a year).
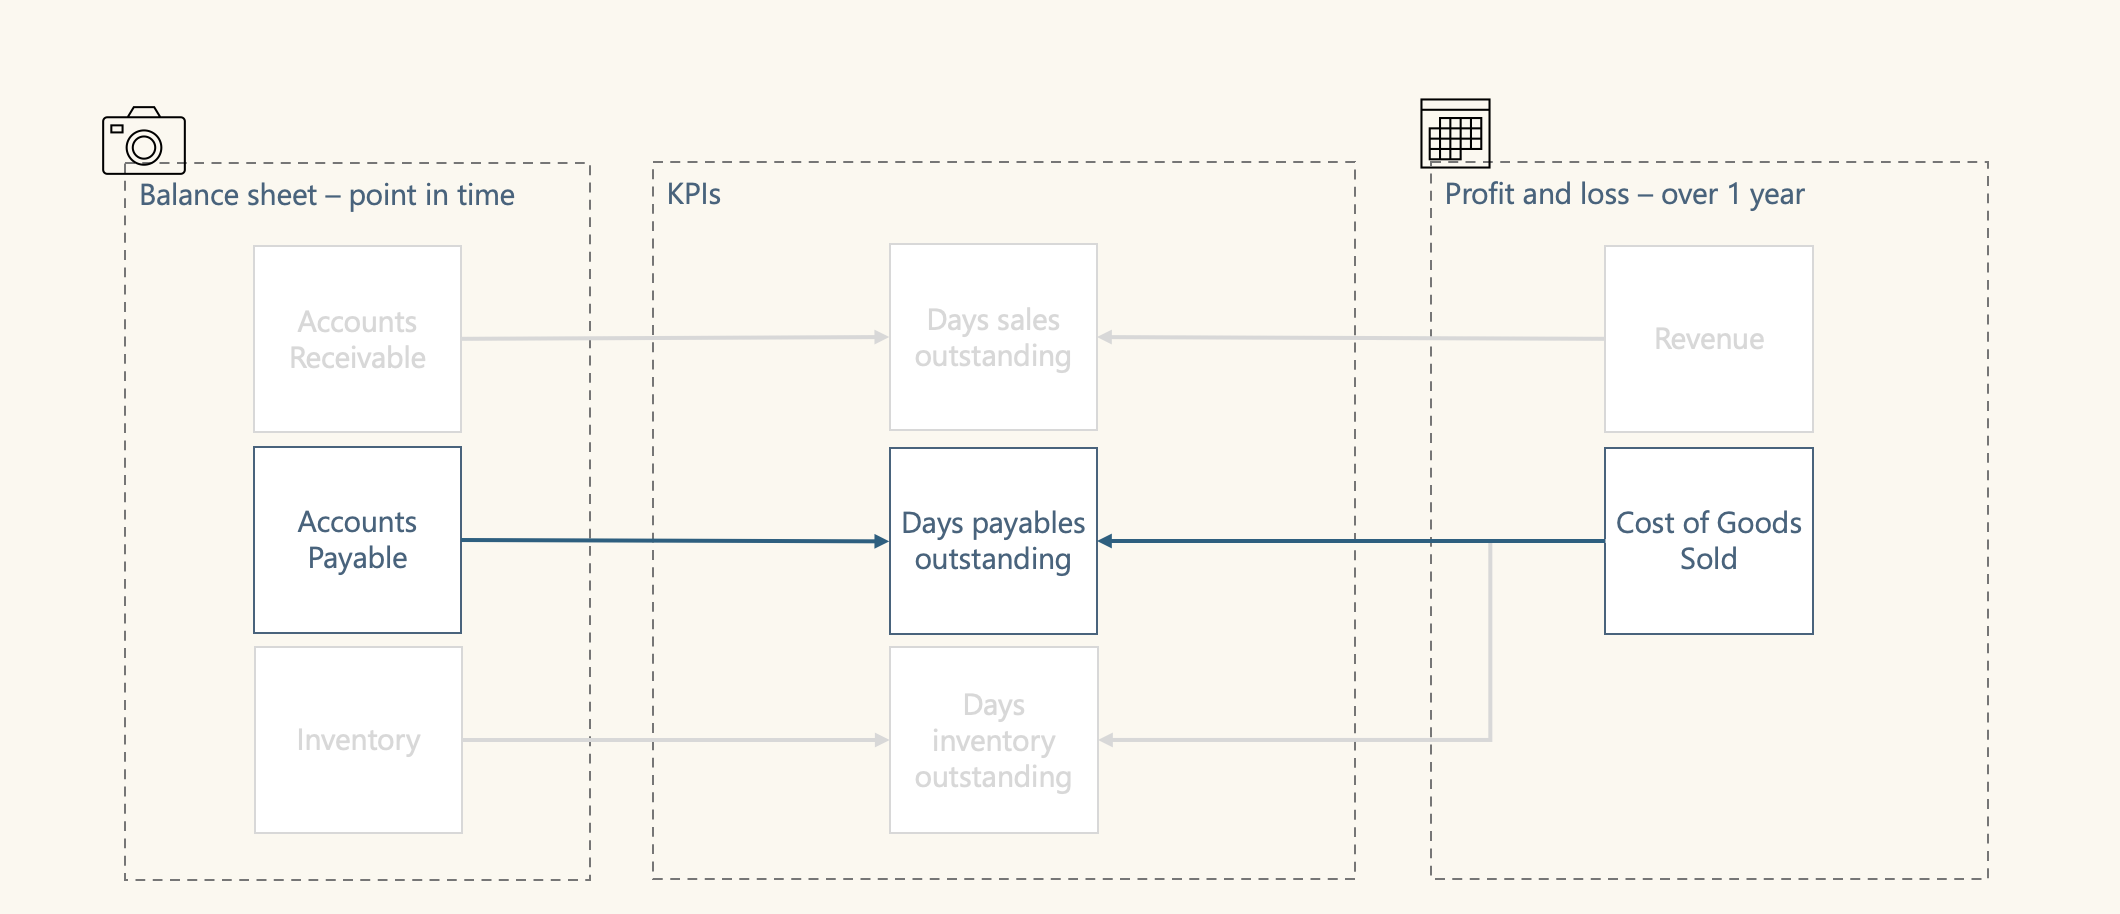
Going back to Tesla:
- A/P at 31/12/24: 18bn
- COS from 01/01/24 to 31/12/24: 80bn
COS covers inventory about 4.5 times a year. Or, put another way, it takes 82 days of COS to pay all open supplier invoices.
To get to 82 days: DSO = (Accounts payable / Cost of sales) * 365
Where:
- Accounts payable is the accumulated balance of open trade payables
- Non-trade AP is excluded
- Cost of sales as described earlier.
Let's look at our comparison companies:
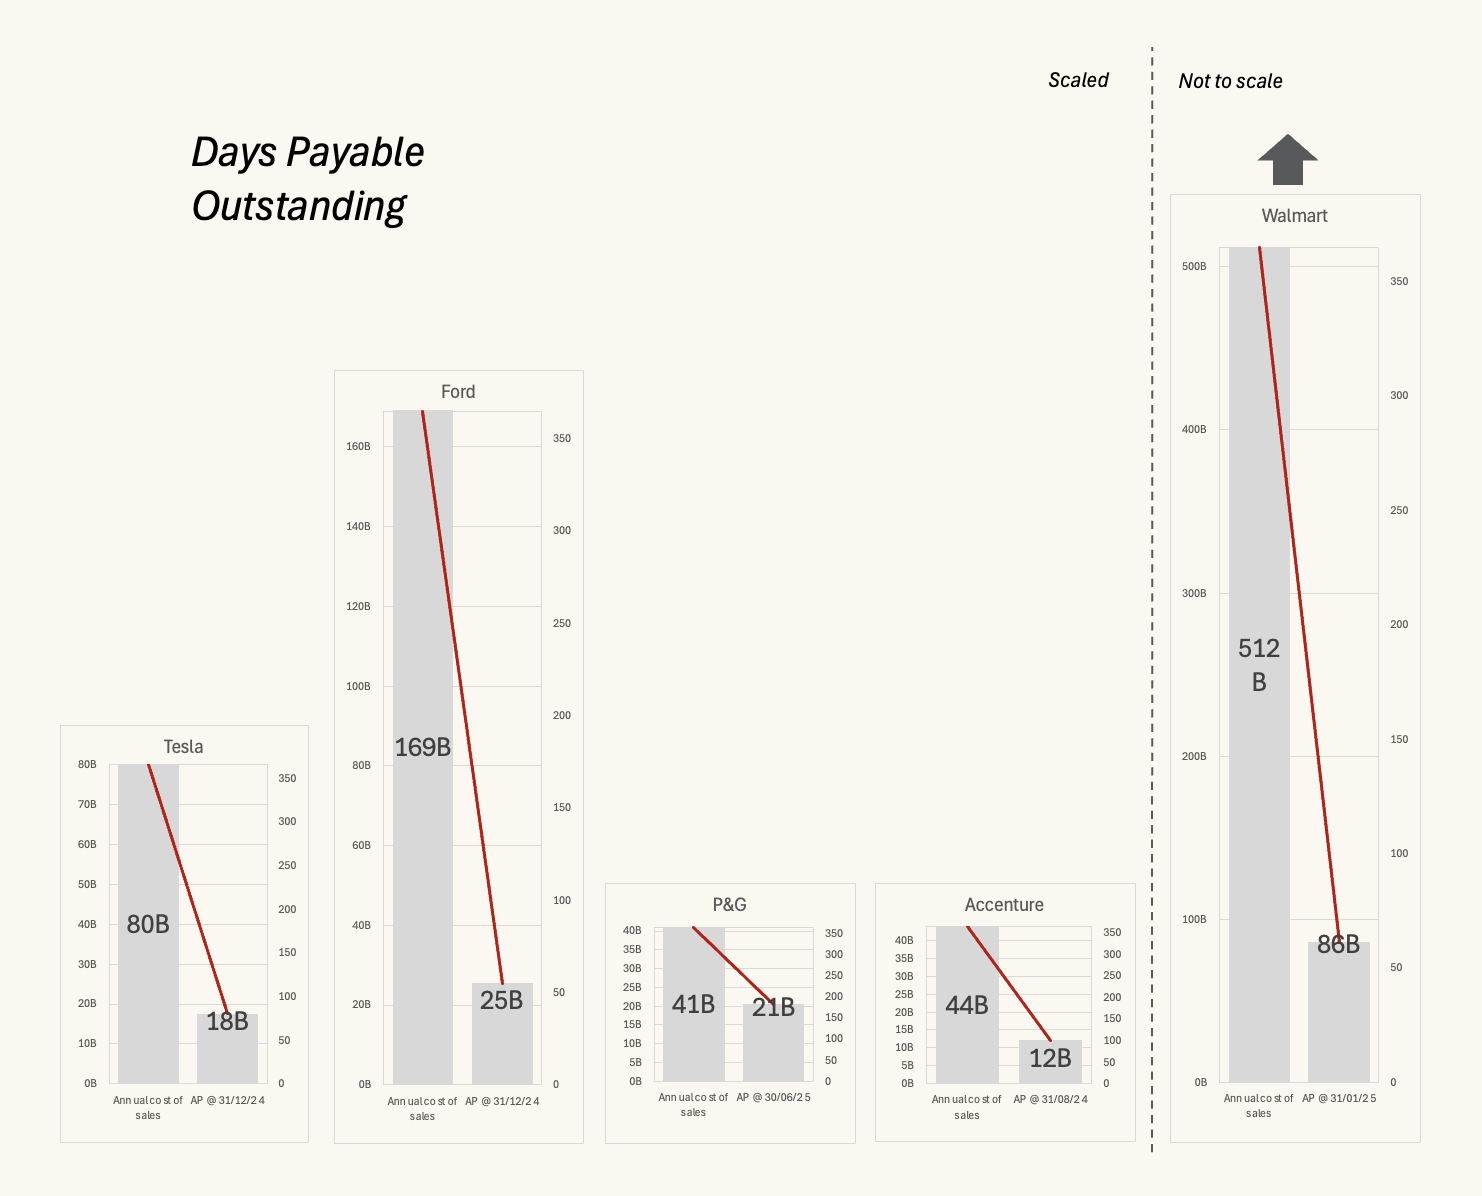
Tesla: 80 days Ford: 55 days P&G: 182 days (fits with typical FMCG strategy) Walmart: 61 days Accenture: 101 days
Interpretation
- High DPO:
- An organisation takes longer to pay
- Suppliers are funding the operation, good for cash flow
- Low DPO
- An organisation pays quickly
- Potentially takes advantage of discounts.
- Average DPO can hide mix of 15 days and 90 days.
- In services DPO is less important, COGS may be tiny or hard to define
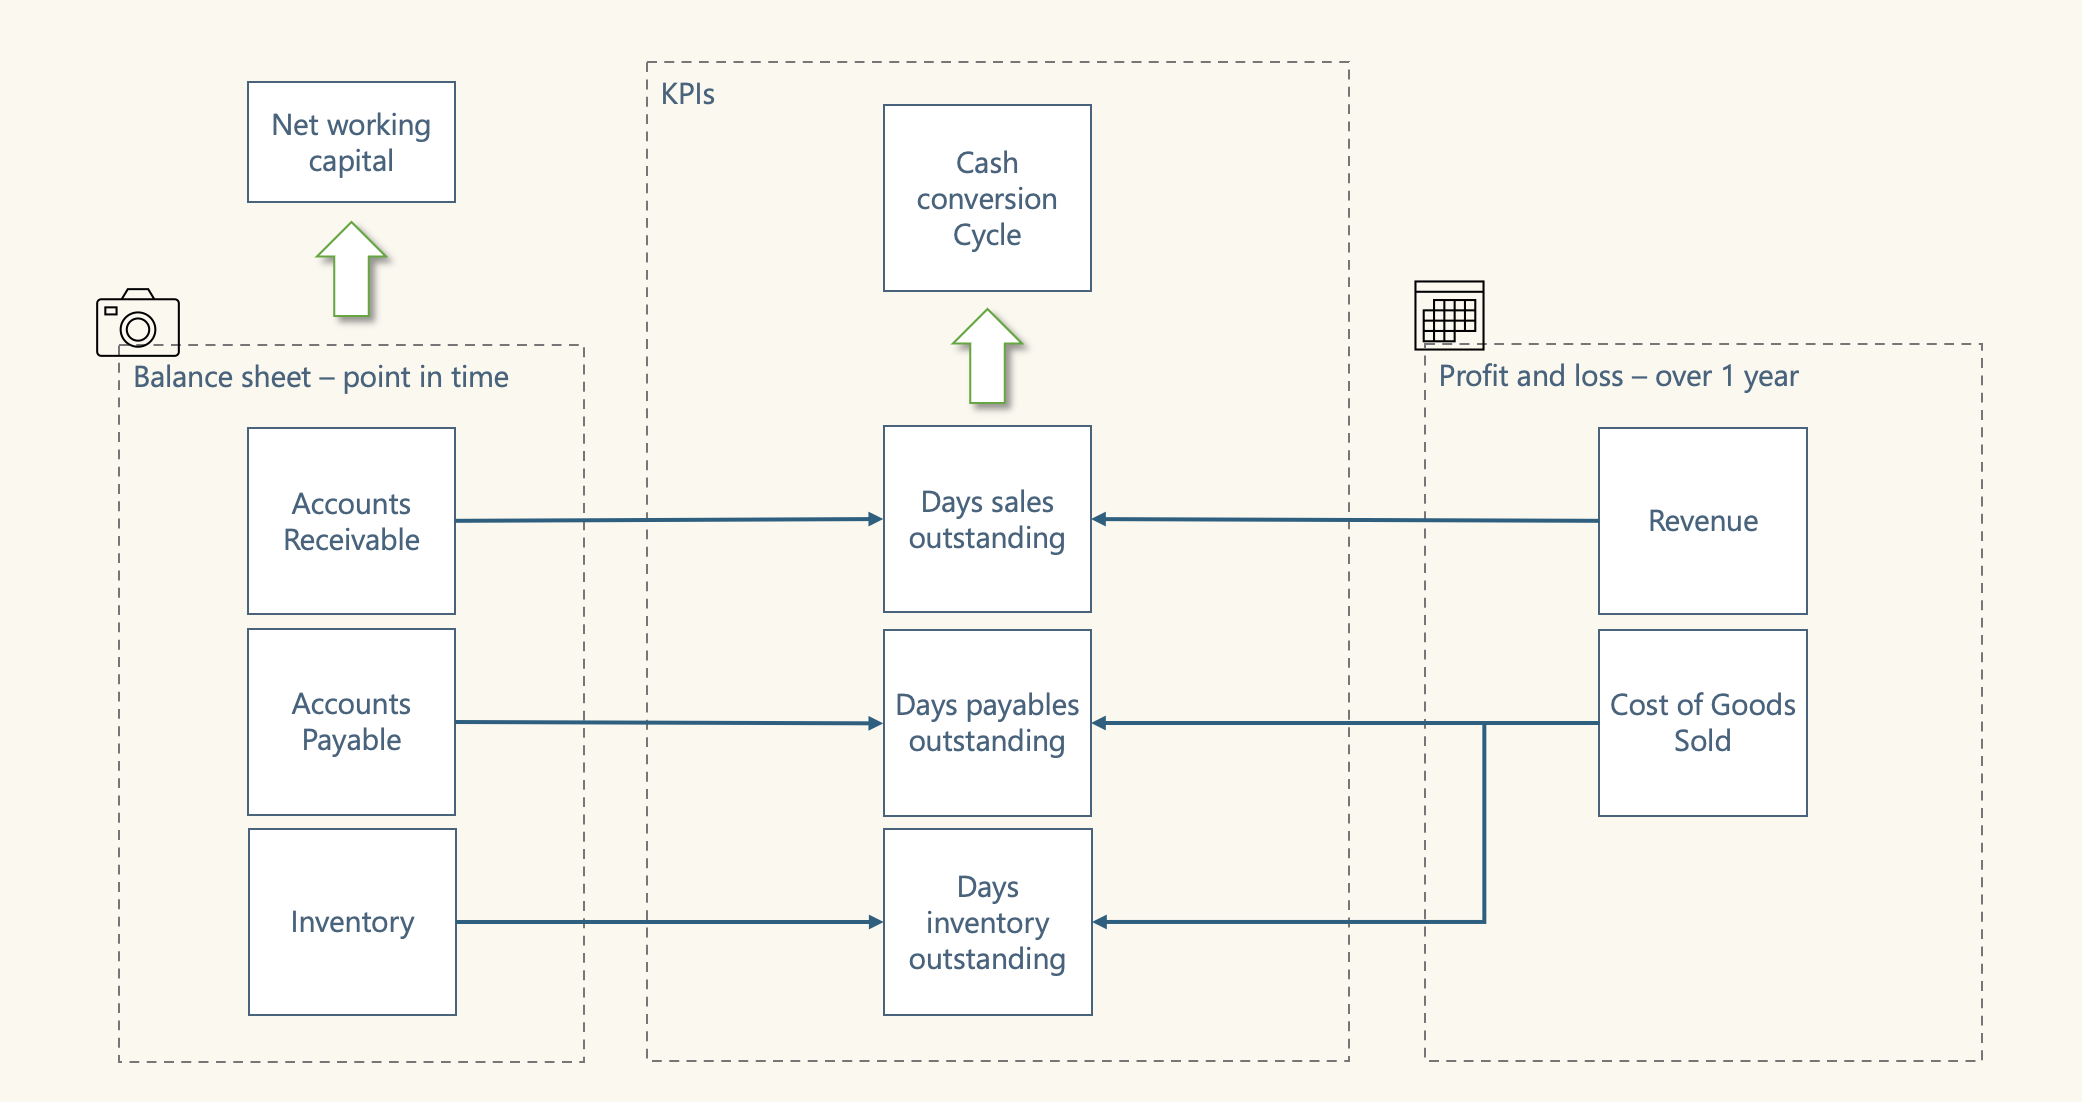
Cash conversion cycle / net operating cycle / cash cycle
DSO, DIO, and DPO can be combined to create the cash conversion cycle (CCC).
Think of:
DSO: Number of days it takes to convert receivables to cash DIO: Number of days it takes to convert stock to receivables or cash DPO: Number of days you hold onto payables.
DSO + DIO can be considered total days to convert assets to cash.
Next, if you think of DPO as number of days to pay suppliers cash we owe them, if you deduct DPO from DSO + DIO you get a measure of the overall number of days it takes to convert net assets to cash.
Looking at our example companies:
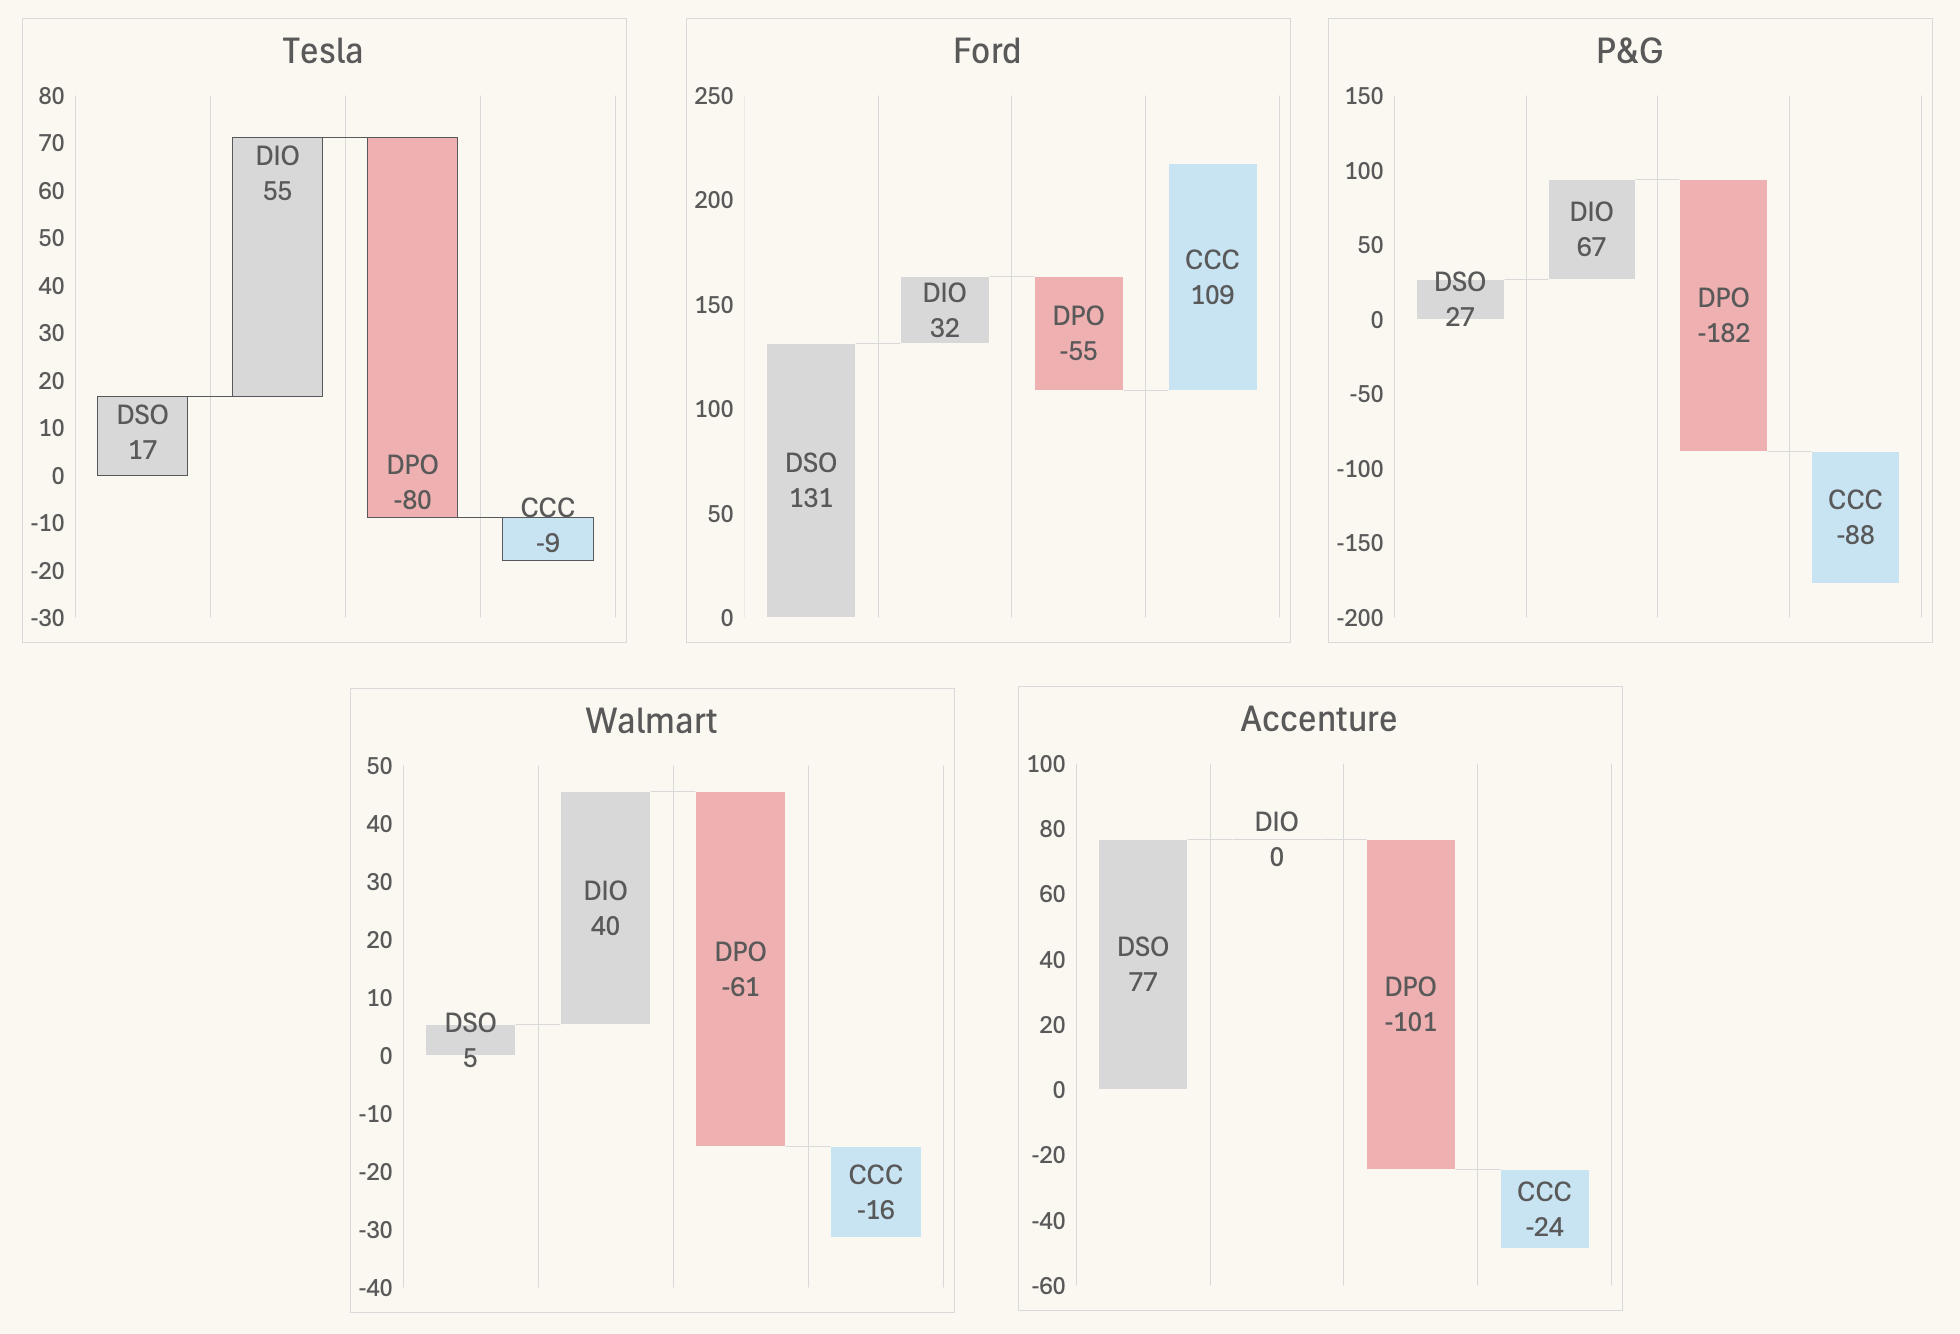
A short cash conversion cycle is that an organisation can convert its assets to liabilities quickly. If the cash conversion cycle is negative, it means the company collects from customers before paying suppliers.
Interpretation
- Composition is important, which is why a waterfall is a useful visual
All companies except Ford are using suppliers to fund their operations. The high DSO at Ford drives their CCC to a higher positive number.
Current and quick ratio
Two popular ratios for working capital are the current ratio and quick ratio.
Current ratio:
- Measure the ability to meet short-term obligations
- Compares current assets with current liabilities
- Expected results vary by industry, rule of thumb:
- Greater than 1: indicates enough liquid assets to cover its short-term debts
- From 1.5 to 3: often considered ideal
- Lower numbers expected in FMCG, retail, who leverage supplier funding.
Current Ratio = Current Assets / Current Liabilities
Tesla: 2.04 Ford: 1.1 P&G: 0.7 Walmart: 0.79 Accenture: 1.46
Quick ratio:
- Also known as the acid-test ratio
- Measures the ability to meet short-term obligations using only highly liquid assets. It excludes inventory.
- Provides a more conservative snapshot of a company's financial health
- 1:1 or higher generally indicates strong short-term financial health
Quick Ratio = (Current Assets - Inventory) / Current Liabilities
Ageing analysis
This isn't as much of a KPI as a process measure. In AP and AR ageing reports show the open items by length of time open.
Keeping on top of AR ageing is very important in ensuring customers are paying in line with agreed payment terms.
Connected to AR ageing are various key process, including:
- Dunning: sending statements and reminders at optimal times
- Provisions: early identification of potential irrecoverable amounts and protective actions such as blocking sales and shipping.
Challenges and complexities
In real life, working capital can be a bit more difficult to calculate and interpret. In this section, I'll look at some of the major challenges and complexities.
The purchase to pay cycle
The purchase to pay (PtP) cycle that hides under DPO is complex. Part of optimising DPO is optimising PtP.
The PtP cycle for physical inventory:
- Where relevant, contracts are agreed with suppliers
- Purchase requisitions/purchase orders are placed based on demand plans
- No financial impact
- When the goods arrive, a goods receipt is posted
- Accounting impact: increase inventory, offset post to GR/IR
- When the invoice is received, an invoice is posted
- Accounting impact: increase AP, offset post to GR/IR
- The invoice is paid
- Accounting impact: decrease cash, reduce AP.
GR/IR is a special control account. It stands for goods receipt/invoice receipt. The GR/IR allows for goods receipts and invoice receipts to be matched with reference to purchase orders. This is the core of the 'three-way' match in PtP.
Outside an ideal PtP flow, various things can happen:
- Goods are received, but not yet invoiced
- Invoices received, but goods were not yet received
- Goods receipt and invoice receipt have a quantity mismatch
- Goods receipt and invoice receipt have a quantity match, but price mismatch.
These scenarios impact working capital.
Invoice received, but goods not received in particular increases our A/P liability on the balance sheet without a matching increase in assets on the balance sheet.
Part of optimising working capital is having a good GR/IR reconciliation process.
Invoice discounts
So far, we looked at simple examples of payment terms:
- 30 days net due
- 60 days net due or 15 days 2% discount
Back at the start of my career, when I worked in an AP product group, our SAP had several hundred payment terms set up.
For example:
- 3% if paid 11th of following month, else 1% if paid 26th, else net 60 EOM.
I re-call recently that SAP added an AI capability to create plain English descriptions of payment terms!
With this level of complexity, it can be very difficult to manage payment terms.
Factors to consider:
- What is organisation's ideal AR and AP payment timing
- What is realistically negotiable with different customer/supplier segments
- Should we offer or take discounts
- Are customers/suppliers actually invoicing with agreed terms
- Often 'actual' postings don't match contract agreements
- Can we implement a form of dynamic term or discounting based on evolving working capital needs over time.
A classic working capital improvement activity is to review contracts, download vendor and customer master data, and transactional data and do an analysis:
- Are our contractually agreed terms optimal
- Do the terms in our master data match those
- Are the actual open invoices paid in line with the terms (timing & discount).
There are various case studies of organisations finding huge amounts of working capital improvement just by this simple analysis.
Revenue recognition
When we ship goods, we reduce inventory (assets). It's important to record the corresponding accounts receivable asset as soon as possible to balance this. This also starts the clock ticking on the AR invoice payment terms.
However, revenue recognition rules can be a little complex.
This is another area where analysis should be done to validate whether an organisation is billing at the right moment (earliest possible).
Within services, without a tangible product, revenue recognition gets a little more complex. Typically, a contract should define 'work packages' that can be easily demonstrated and used as a basis of booking service delivery and billing/invoicing. From a working capital perspective, the structure of the contract deliverables is very important.
It's not uncommon in services to see disputes around quality and completeness of delivery, leading to significant delays to the ability to bill.
As a consultant, I've personally had issues with this! In one case when a client wasn't happy with a deliverable, my billing ended up happening two months later than planned. Lesson learned - make the contract much clearer on the minimum level of delivery for billing.
Timing
All the KPIs are based at least partly on the balance sheet at a point in time, they are very sensitive to operational events
- Consider average rather than period-end numbers
- Understand seasonal impacts and look at the trend
- Be aware of significant business events that might skew numbers
- Unusually high purchase or sale.
Intercompany flows
The sample company numbers we have looked at so far come from annual accounts. Preparing those takes a big effort and a long time. Those numbers are not available on a real-time basis for daily operations.
A big part of the issue in preparing working capital KPIs is intercompany.
The below diagram is an illustrative mock-up for a multinational focused on tax efficient operations. The main features are:
- Regardless of physically location, the inventory, WIP, and finished products are owned by an entity (entrepreneur) in a country with low corporate tax
- The manufacturer charges a service fee to the entrepreneur for converting the raw materials to finished products (it's like an internal contract manufacturer)
- Sales entities buy the finished product at a 'high' price from the entrepreneur and sell at a slightly higher price to customers.
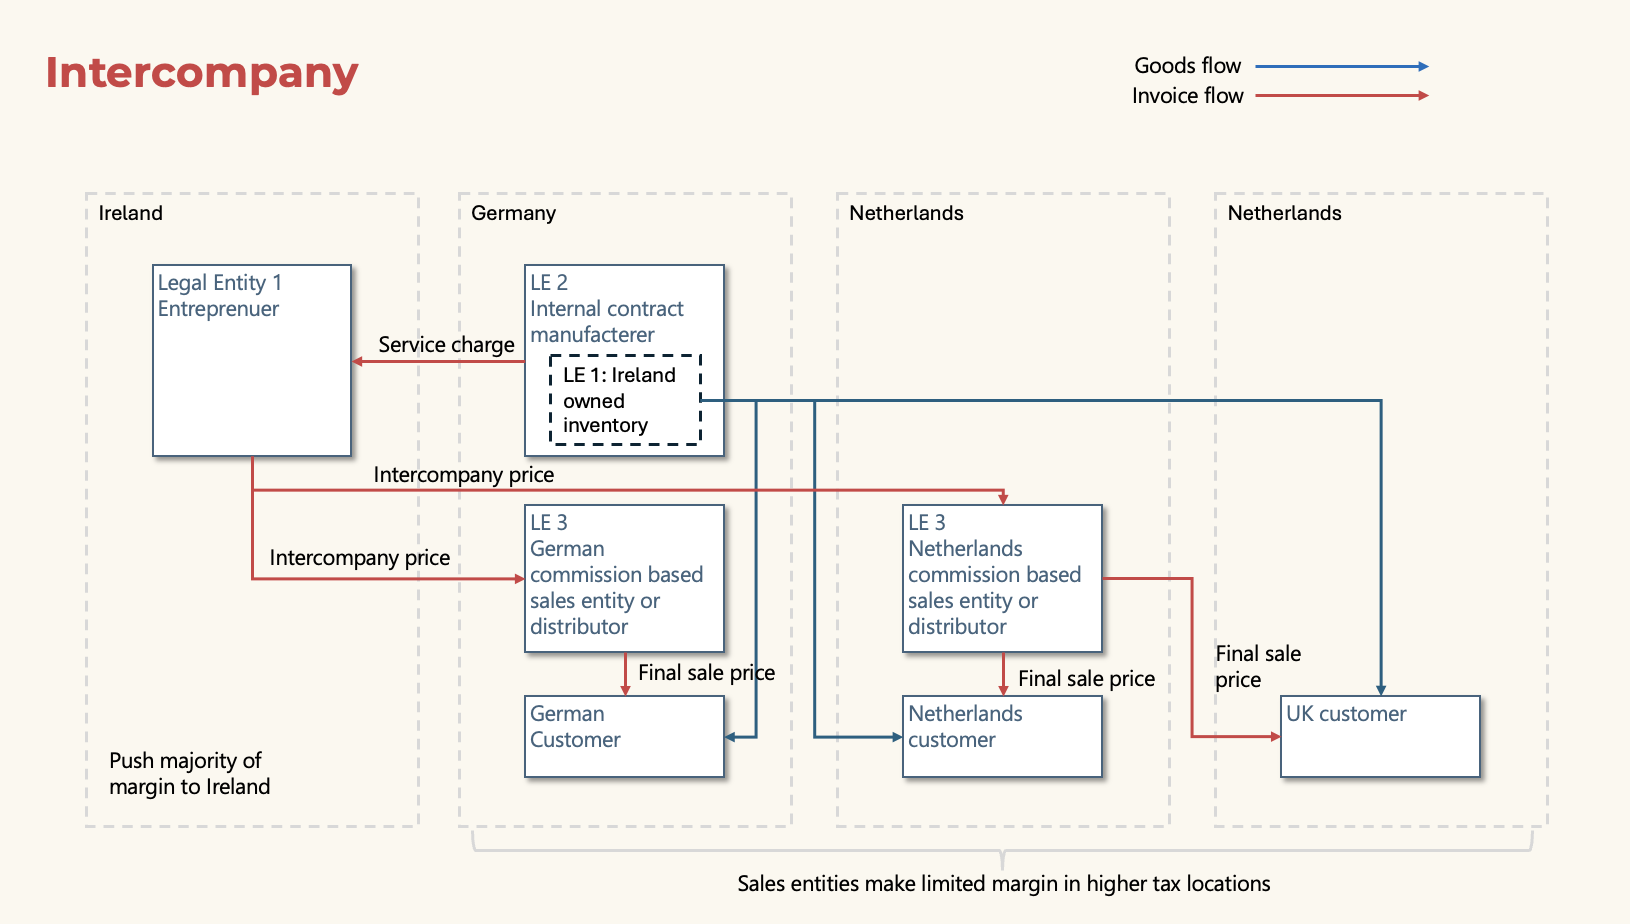
With this model, the maximum amount of margin is earned in a location with low tax rates.
This model is well established. SAP has long had functionality called 'plants abroad' to do this.
Unfortunately these intercompany flows make it hard to calculate true NWC, DSO, DIO, DPO as cash, AR, inventory, and AP is split across entities.
Periodic financial closing includes the elimination of intercompany, but we don't want to wait for closed books every month to look at working capital.
It's easy to look at reports about a single legal entity, but this often doesn't give us a country/product/region/group-wide view.
Business systems architecture
Another big challenge in calculating working capital comes from business systems architecture.
In multinationals, we rarely have a single ERP, that we can log on to and check KPIs.
Here is an abstraction of a relatively simple multinational ERP architecture.
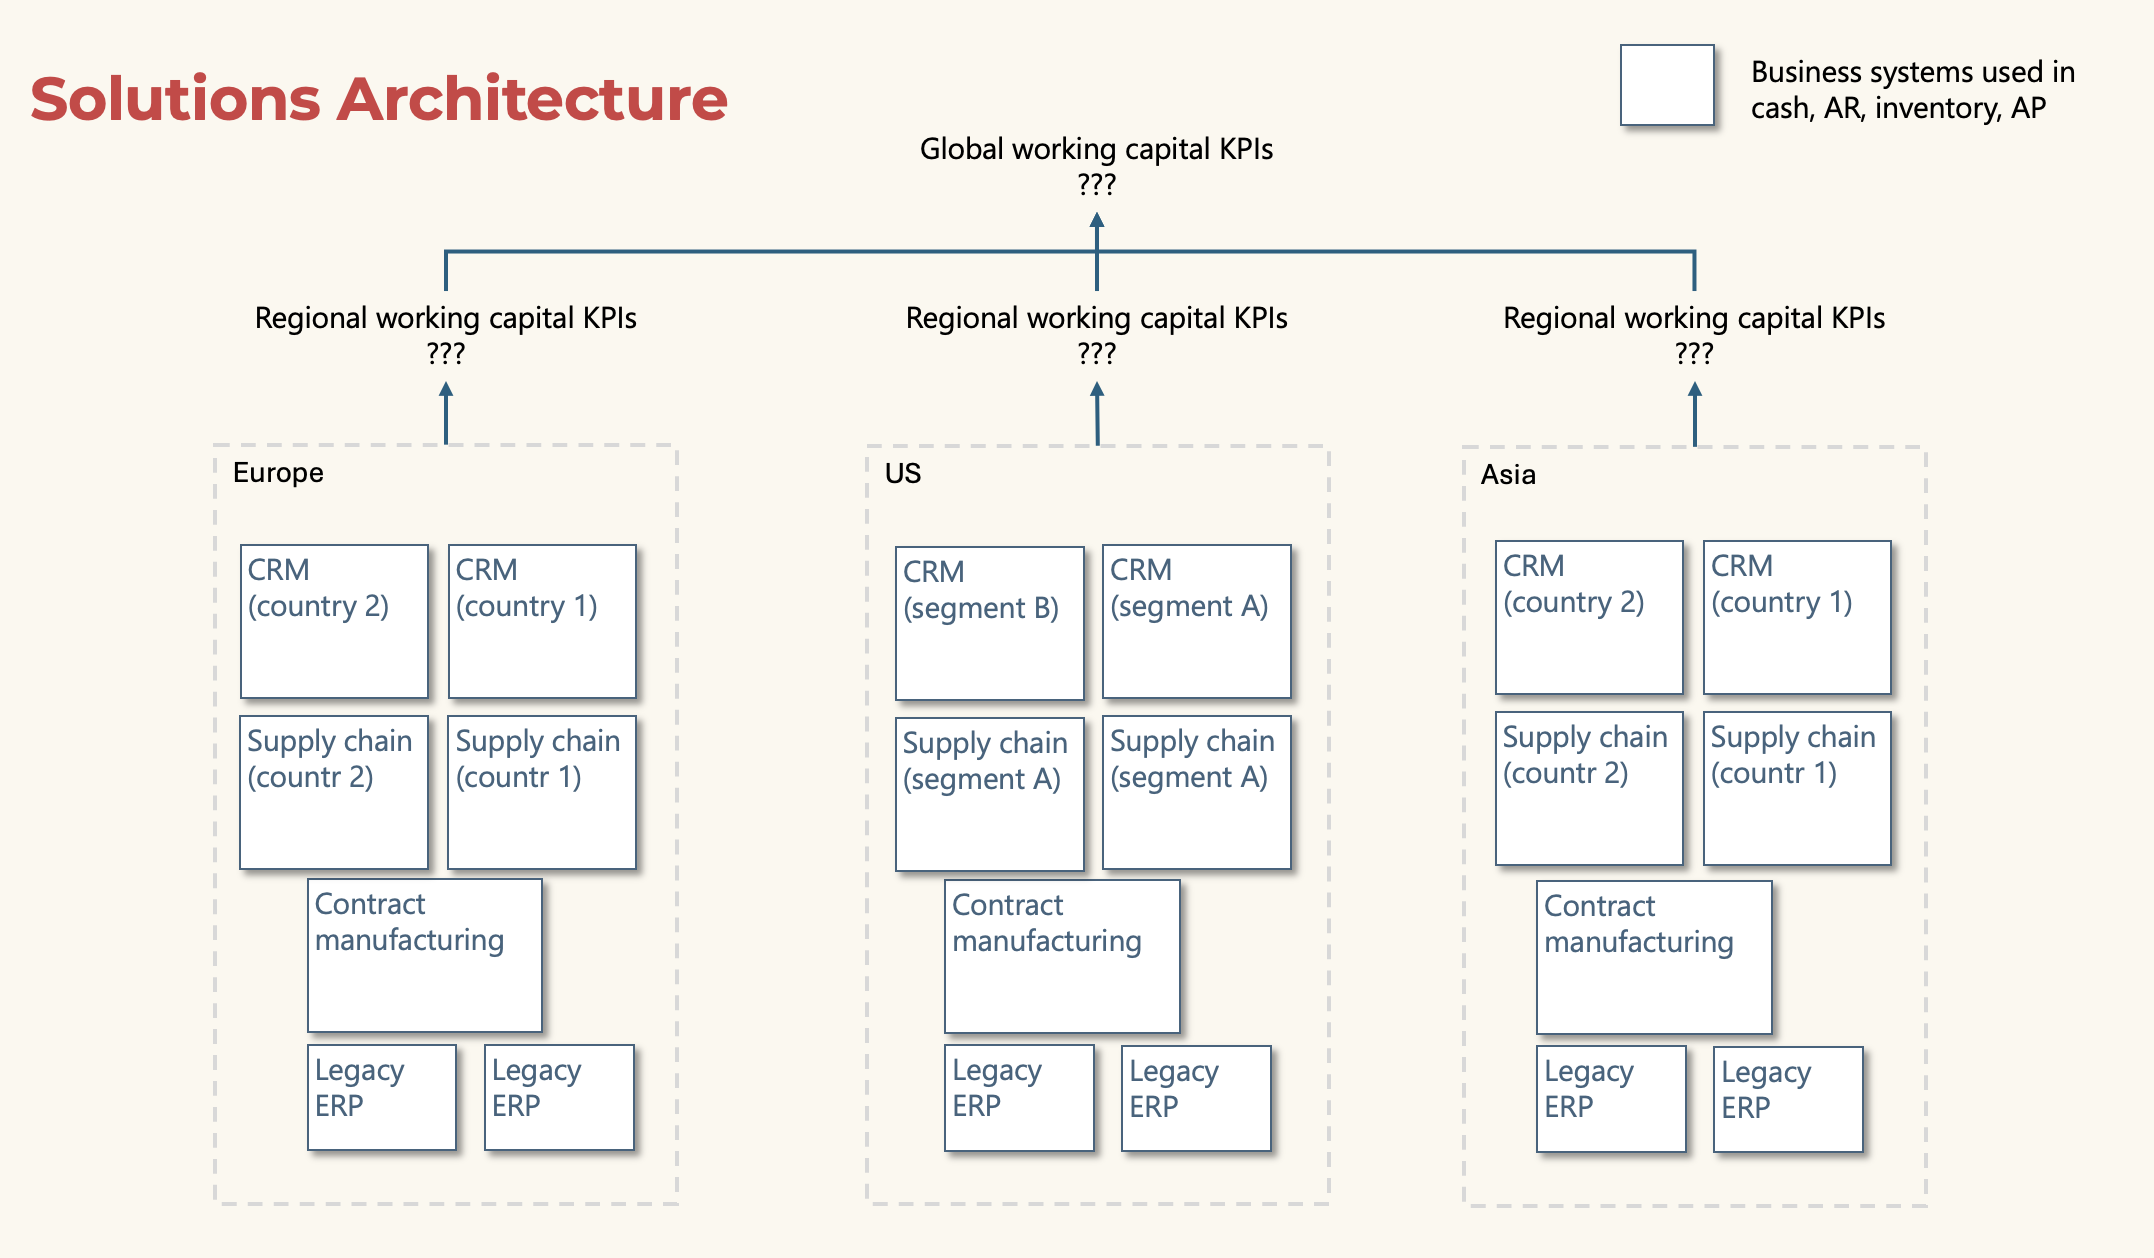
There are often multiple systems per country, entity, and category. These are the systems that hold the cash, receivables, inventory and payables data we need.
The periodic financial closing will consolidate this data on a periodic basis in a trusted way. However, this is not available on a day-to-day basis.
The traditional solution to sending ERP data to external data & reporting systems. However, from a financial perspective, this is not ideal.
ERPs are controlled accounting systems. When you take data out of an ERP, trust degrades. This is a key concern for important KPIs like working capital used in key business decisions.
Other topics
A few additional comments by industry:
Manufacturing
- Split analysis by raw materials, work in progress, and finished product for more insights
- Remove consignment stock if not owned.
- Longer production cycles generally require higher working capital
- Improve work in progress control & yield to free up capital
- Reducing minimum order quantity can improve DIO
- Long lead times can increase DIO, try to align with DPO
Retail
- Generally low working capital needs due to cash sales
- High DSO would be very concerning
- Gift cards help generate cash, but are an interest free loan from customers and the balance sheet liability needs to be carefully managed
Economic and market conditions
Alongside internal KPIs, several economic and market factors should be monitored:
- Inflation
- Increases costs of all inputs, increasing need for capital
- Increasing cost to access cash
- Economic cycles
- Changes in consumer demand affect inventory and AR
- Downturns: need for sufficient cash to cover short-term obligations
- Upturns: short term cash for fast growth/expansion
- Major unexpected
- Organisations may want to stress test their capital situation to deal with the unexpected:
- Political events (e.g. Brexit)
- Natural disasters (e.g. Earthquake/Tsunami)
- Changes to trade tariffs (e.g. Trump's tariffs)
- Global supply chain incidents (e.g. 2021 Ever Green Suez blockage)
- Organisations may want to stress test their capital situation to deal with the unexpected:
Working capital opportunities
A brief checklist to consolidate the factors to consider when trying to improve working capital:
- Invoice terms
- Review AP and AR terms across contract, systems, actuals (timing/discounts)
- Extend AP as much as possible w/out risking supplier stability
- Planning
- Investigate forecast accuracy, and look to optimise
- If not doing, utilise scenario analysis and variance analysis
- Receivables
- Investigate AR efficiency (credit terms, invoice ageing, dunning)
- Reduce/eliminate any risky credit lending causing working capital issues
- Offer incentives for cash or early payment on AR
- Inventory
- Optimise stock levels, look at minimum order quantity and lead time
- Operations
- Shorten operating cycle
- Financing
- Manage terms vs. loans as a way to raise cash
- Reporting
- Aim to design/implement real-time reporting on working capital
- Improve cash visibility.
Advanced topics
Supply chain financing
Generally speaking, an organisation wants to pay for their purchases as late as possible. Powerful multinationals will often try to negotiate 90 days, or at least 60 days payment terms.
On the flip side, suppliers want to get cash as quickly as possible. They may need this for various reasons; funding their own purchases, investing in growth, etc.
When I worked at Procter & Gamble, I remember the power the big UK supermarkets had over us. But then again, I also remember the power we had over our suppliers.
This situation can make it difficult for a customer and its supplier to reach a mutually beneficial relationship with payment timings that work for both parties.
Supply chain financing involves bringing a financial services organisation as an intermediate. They pay the supplier early, and receive payment from the customer later.
The mechanisms can get a little complicated when it comes to payment dates, discounts, and fees. However, this model can be highly beneficial for a customer and supplier if working capital is of critical importance to them.
Recently, there are various case studies of supply chain financing in the ESG space. In this area large organisations may want to buy from smaller, independent suppliers, but they may not want to meet the early payment needs of those small businesses. Supply chain financing can bridge this gap.
Walmart and HSBC are partnering on supply chain financing in the ESG space. This partnership allows Walmart to engage with smaller suppliers focussed on sustainable practices. This is how SCF can help preserve a supplier's working capital
Suppliers taking a loan could have the same effect, however, supply chain financing leverages the buyers' creditworthiness. This is one of the main reasons it can work well in ESG.
Finance vs. discounts
One important topic which is overlooked related to working capital is whether to take or receive discounts.
- In AP suppliers may offer discounts for early payment
- In AR an organisation may offer customers discounts for early payment.
Taking advantage of discounting can improve cash flow, but at the expense of profit margin.
Cash flow can also be improved through lending. Therefore, discount opportunities can be evaluated in terms of the cost of lending to make a decision on the optimal way to improve working capital.
Organisations that set payment terms and do not regularly review them may be offering discounts when it would be better to take advantage of lending or other methods to improve cash flow.
A model can be built to compare the short term cost of funds and the impact of discounts.
This topic is rarely covered in working capital reporting.
In theory, an overlay could be added to working capital reporting showing Discount ROI vs. Funding Cost with supplier segmentation.
Limitations of working capital KPIs
A brief checklist to consolidate the limitation of working capital KPIs
- Operations are always changing
- Working capital KPIs are out of date the second they are generated
- Liquidation valuation
- NWC represents a theoretical liquidation of current items
- Real-life liquidation values will be lower than current BS values
- Top level KPIs don't explain the specific nature and state of assets
- A/R total may hide:
- Collection issues
- Ensure provisions for bad debts are up-to-date
- Collection issues
- The asset numbers may hide inability to sell
- Inventory total may hide:
- Obsolete items
- Damaged items
- Stolen items.
Reporting in business systems featuring SAP
ERP: SAP ECC & S/4HANA
When it comes to ECC and S/4HANA there are numerous reporting options for working capital.
Baseline from ECC
- Standard GUI reports
- For deep dive table extracts:
- AR/AP line items: BSID/BSAD, BSIK/BSAK
- Inventory and movements: MBEW, MARD, MKPF/MSEG
- SAP business warehouse for custom DSO/DPO/DIO calculations.
In S4/HANA:
- Universal Journal ACDOCA for finance and CO in one place.
- Material movements via MATDOC; better WIP/settlement visibility.
- Fiori apps:
- Embedded Analytics: CDS views, analytical queries
- Fiori apps for AR/AP ageing, inventory turns, CCC.
The problem with ECC and S/4HANA reporting is not necessarily the reporting capability of the system, it's the intercompany and solutions architecture points we looked at before. In most multinationals, the full operational flow doesn't exist in one system for a country or business unit. This makes the in-built reports less useful.
Financial consolidation
There are multiple solution options for financial consolidation. These systems and processes are used to calculate the KPIs that we've taken from annual reports in this article. However, these are not much use when it comes to getting real-time visibility on working capital.
BDC - Intelligent Working Capital Insights App
SAP recently launched the 'Intelligent Working Capital Insights Application'.
There's a BDC free trial where you can configure and experiment with this app.
- This is a pre-built analytical app presented in SAP analytics cloud
- Data is sourced from line of business systems such as S/4HANA
- The data is sourced as 'Data Products'
- Datasphere acts as the semantic layer:
- Federate S/4 + ECC + non-SAP
- Create analytical models
- Databricks can be utilised to build in ML models, scenarios, etc.
Features:
- Pre-delivered integration and KPI rich content out of the box
- Working Capital Insights app on top: curated KPIs, drill-downs, and alerts.
- Show how the app decomposes the high-level KPI into driver charts
- Inventory value/turns
- Ageing buckets
- Supplier term adherence
- Things headline CCC can’t
SAP Help - BDC working capital intelligent insights
SAP Help - SAC working capital intelligent insights
The app itself is split into five pages:
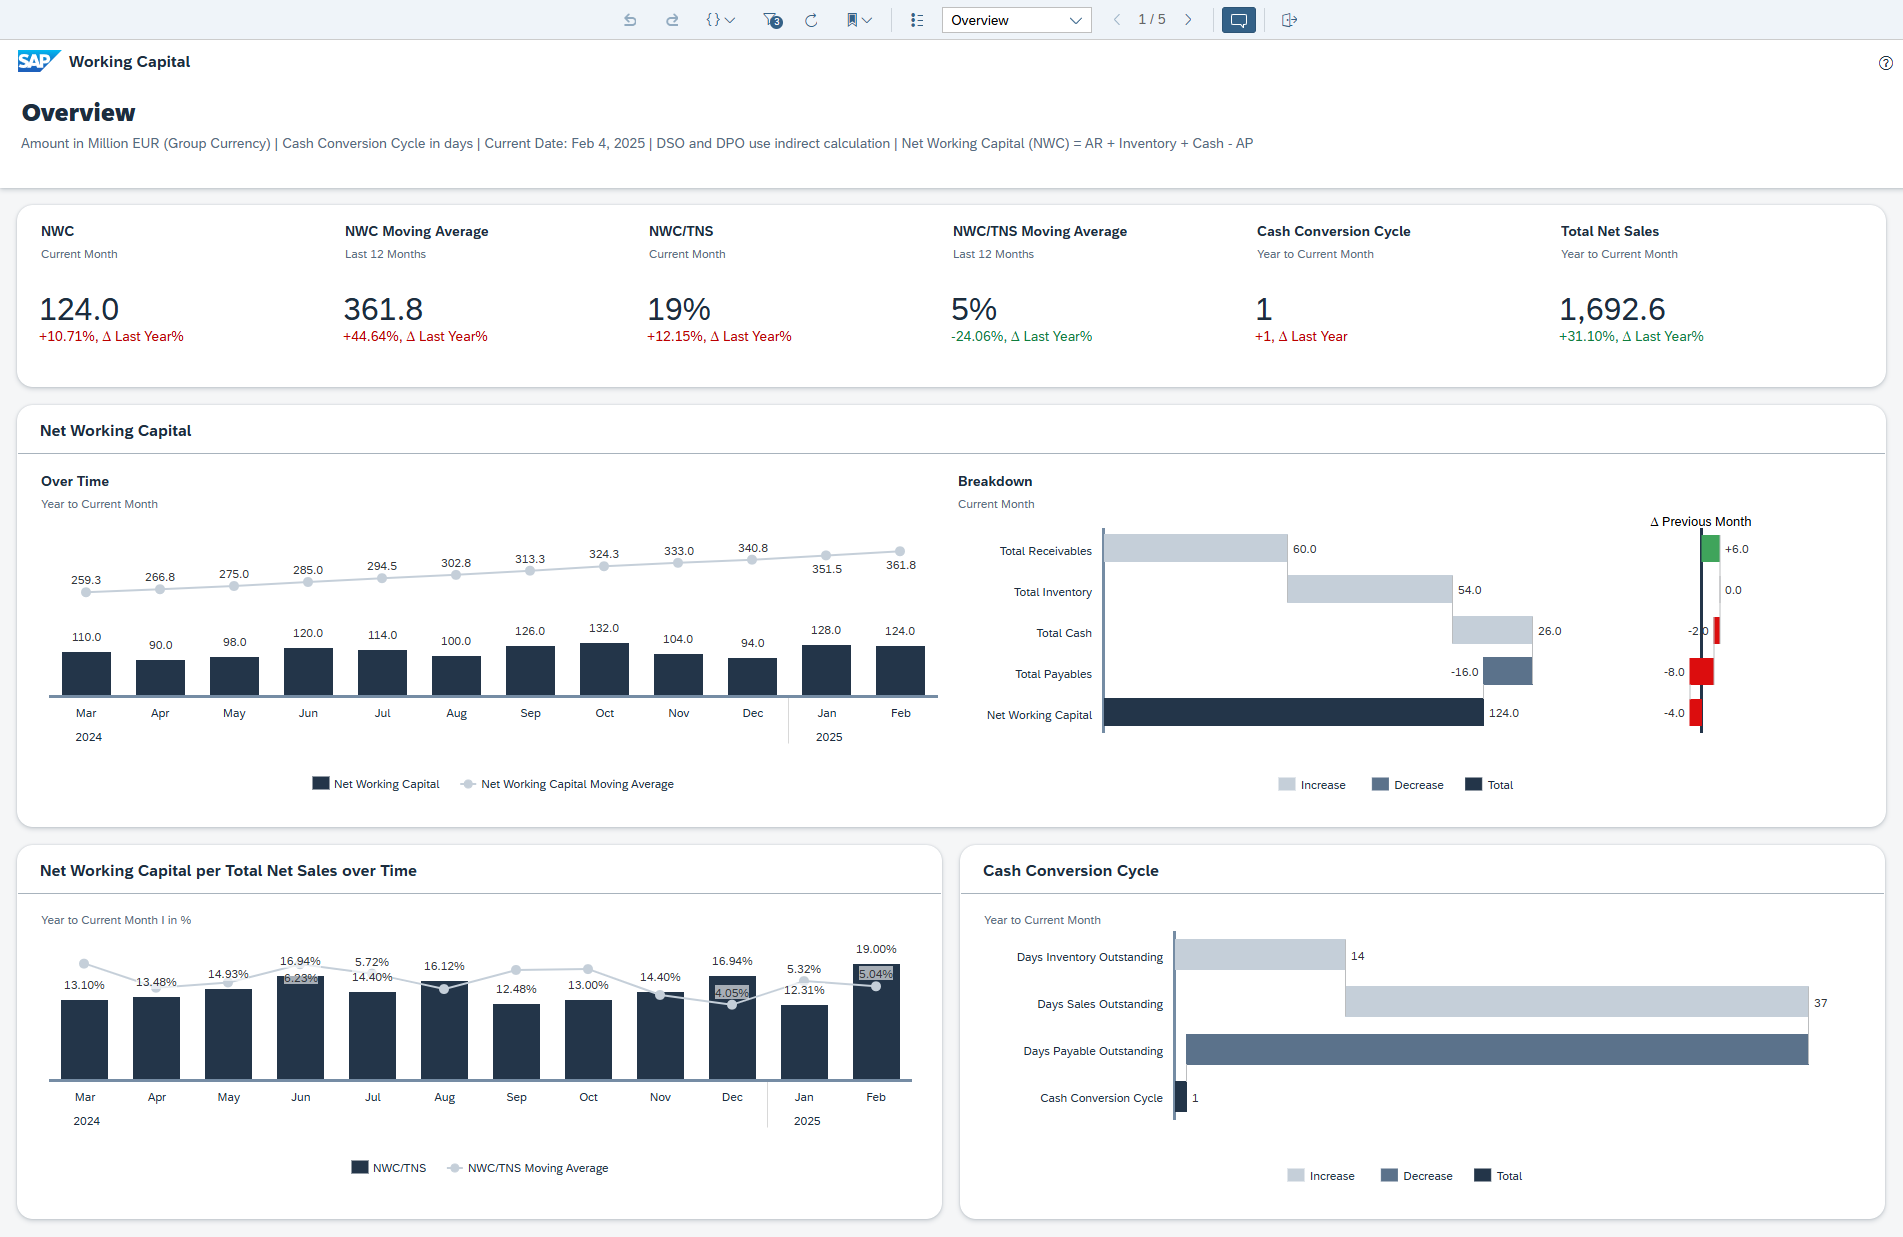
Overview page
Have a look at the below screenshot from the BDC trial / documentation. A few observations on this:
- Great to see the NWC trend over time alongside the visual breakdown
- Nice to see a ratio with sales to provide more context to NWC.
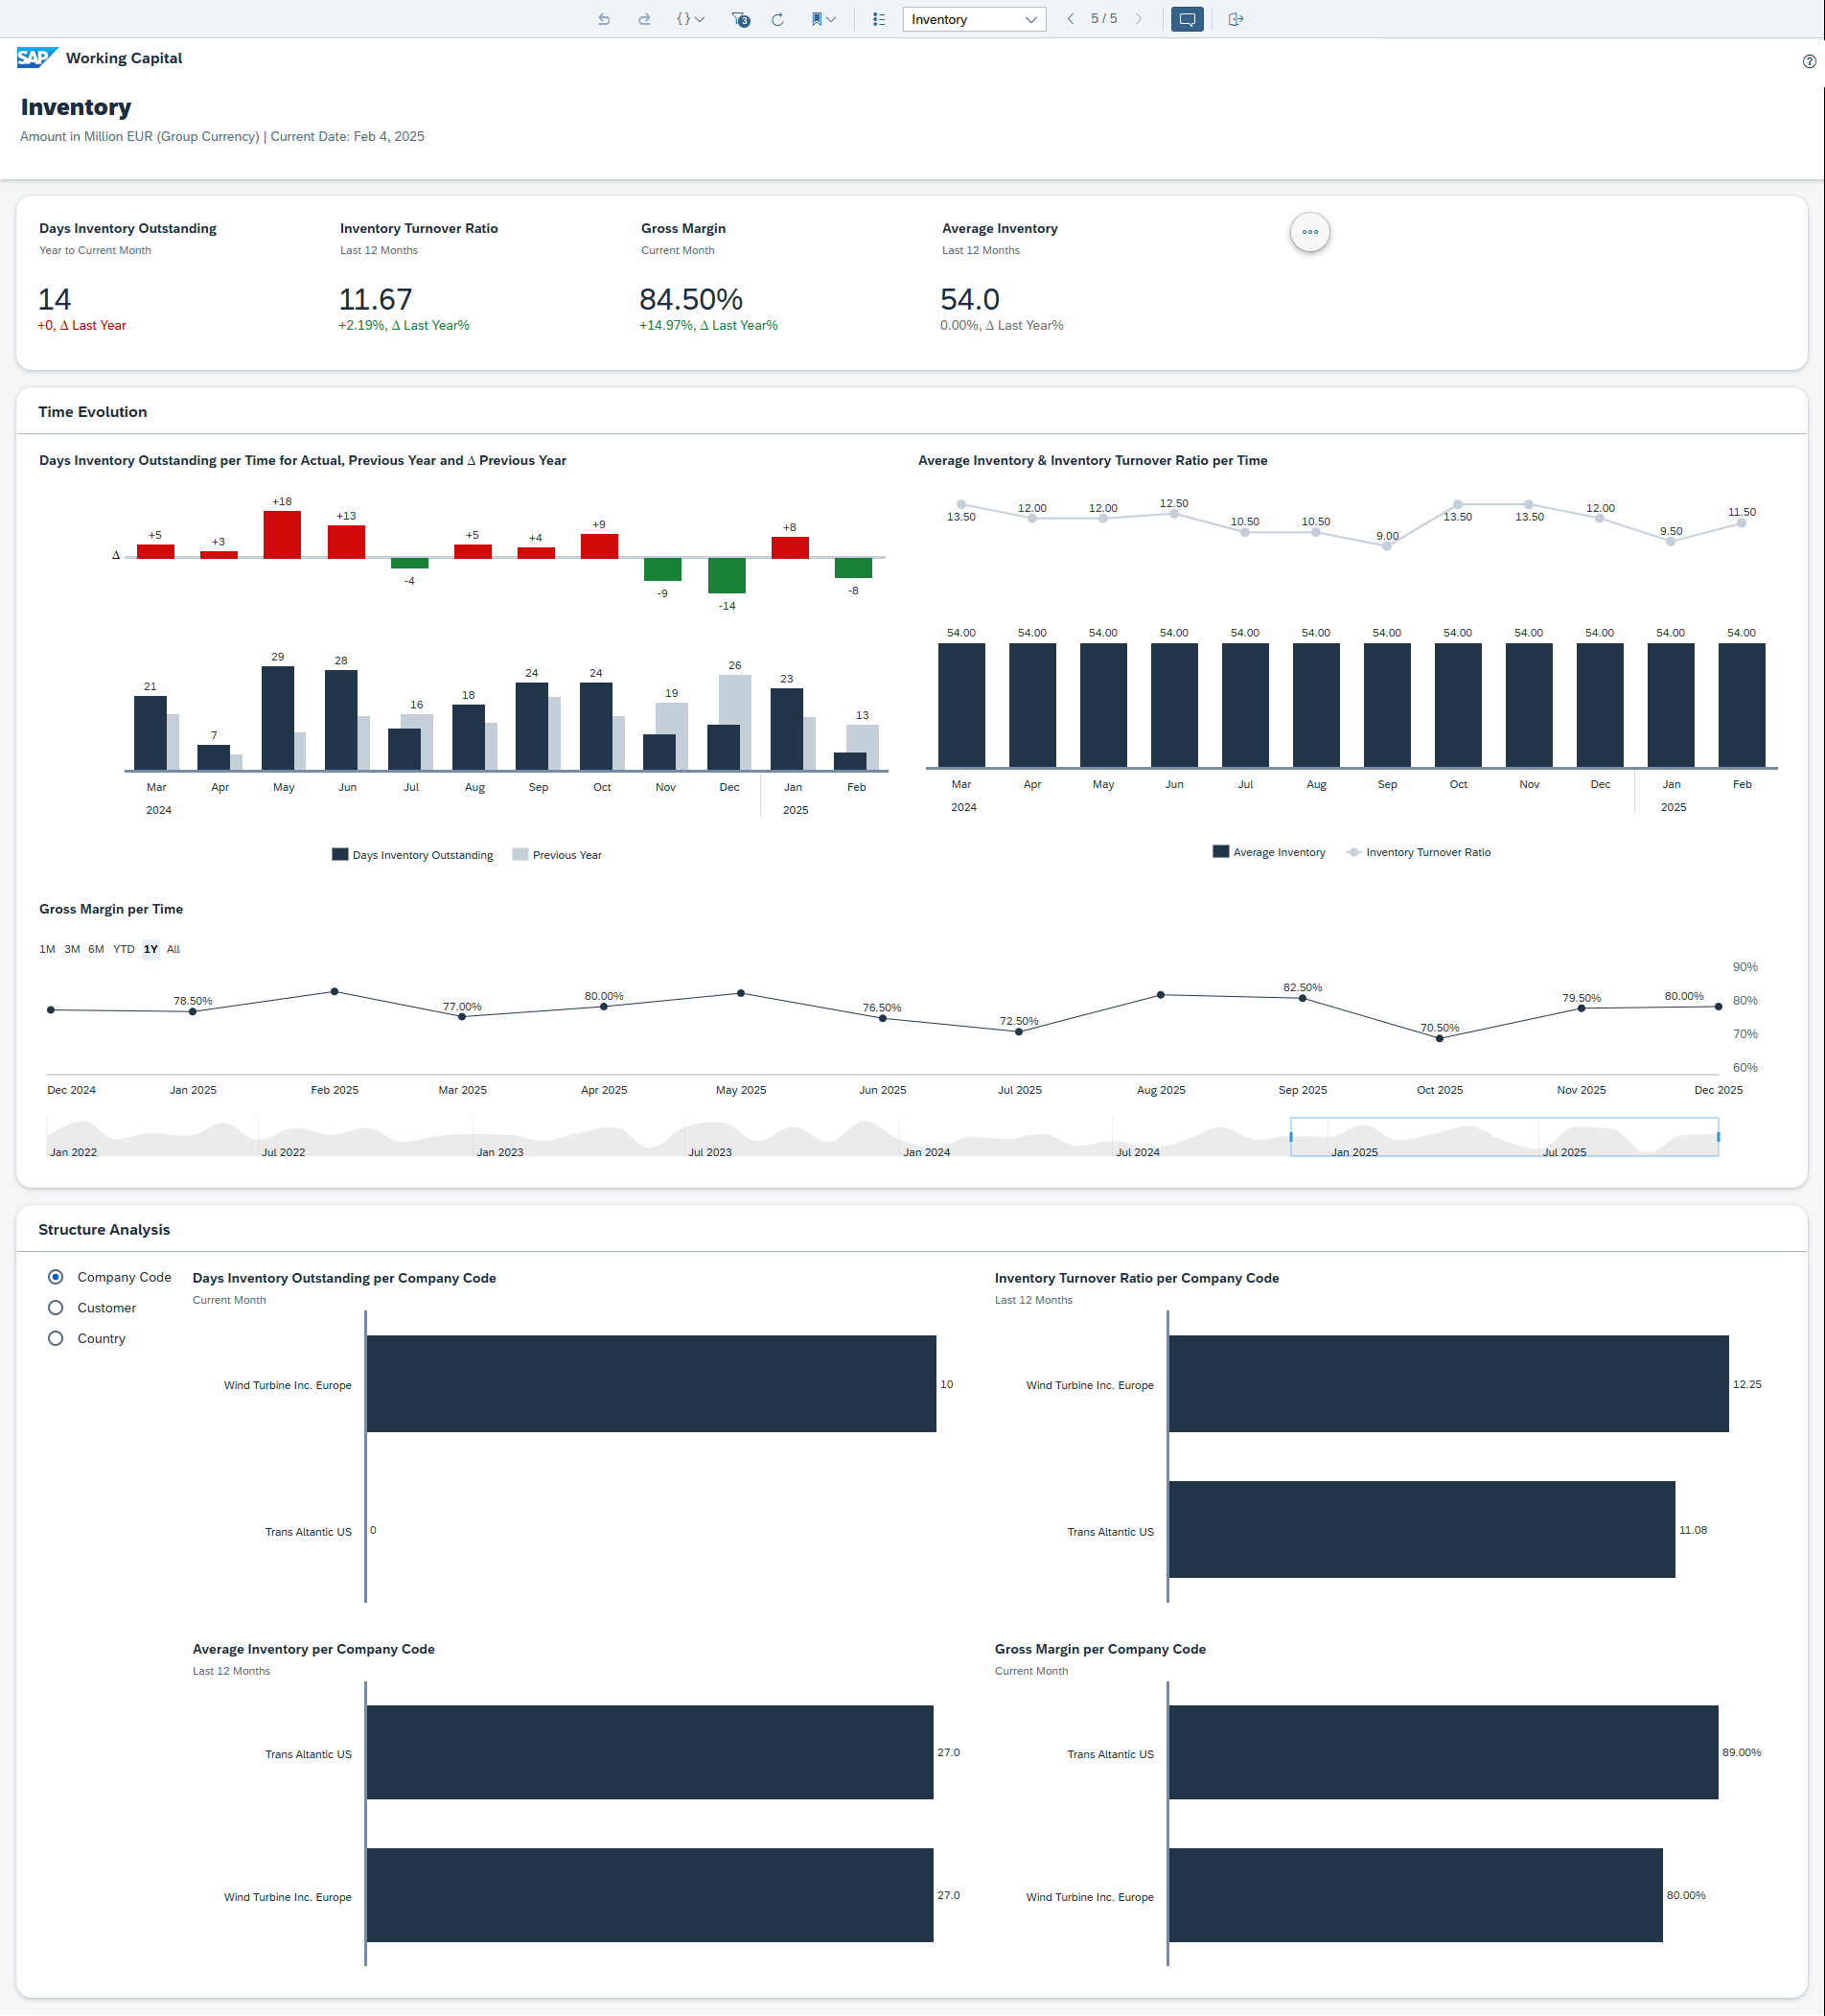
Inventory page
This is where magic starts to happen, we can see our DIO, and immediately get a visual on important things that explain it:
- Trend over time
- Side by side view with key inventory KPIs (average and turnover)
- Structural analysis (company, customer, country)
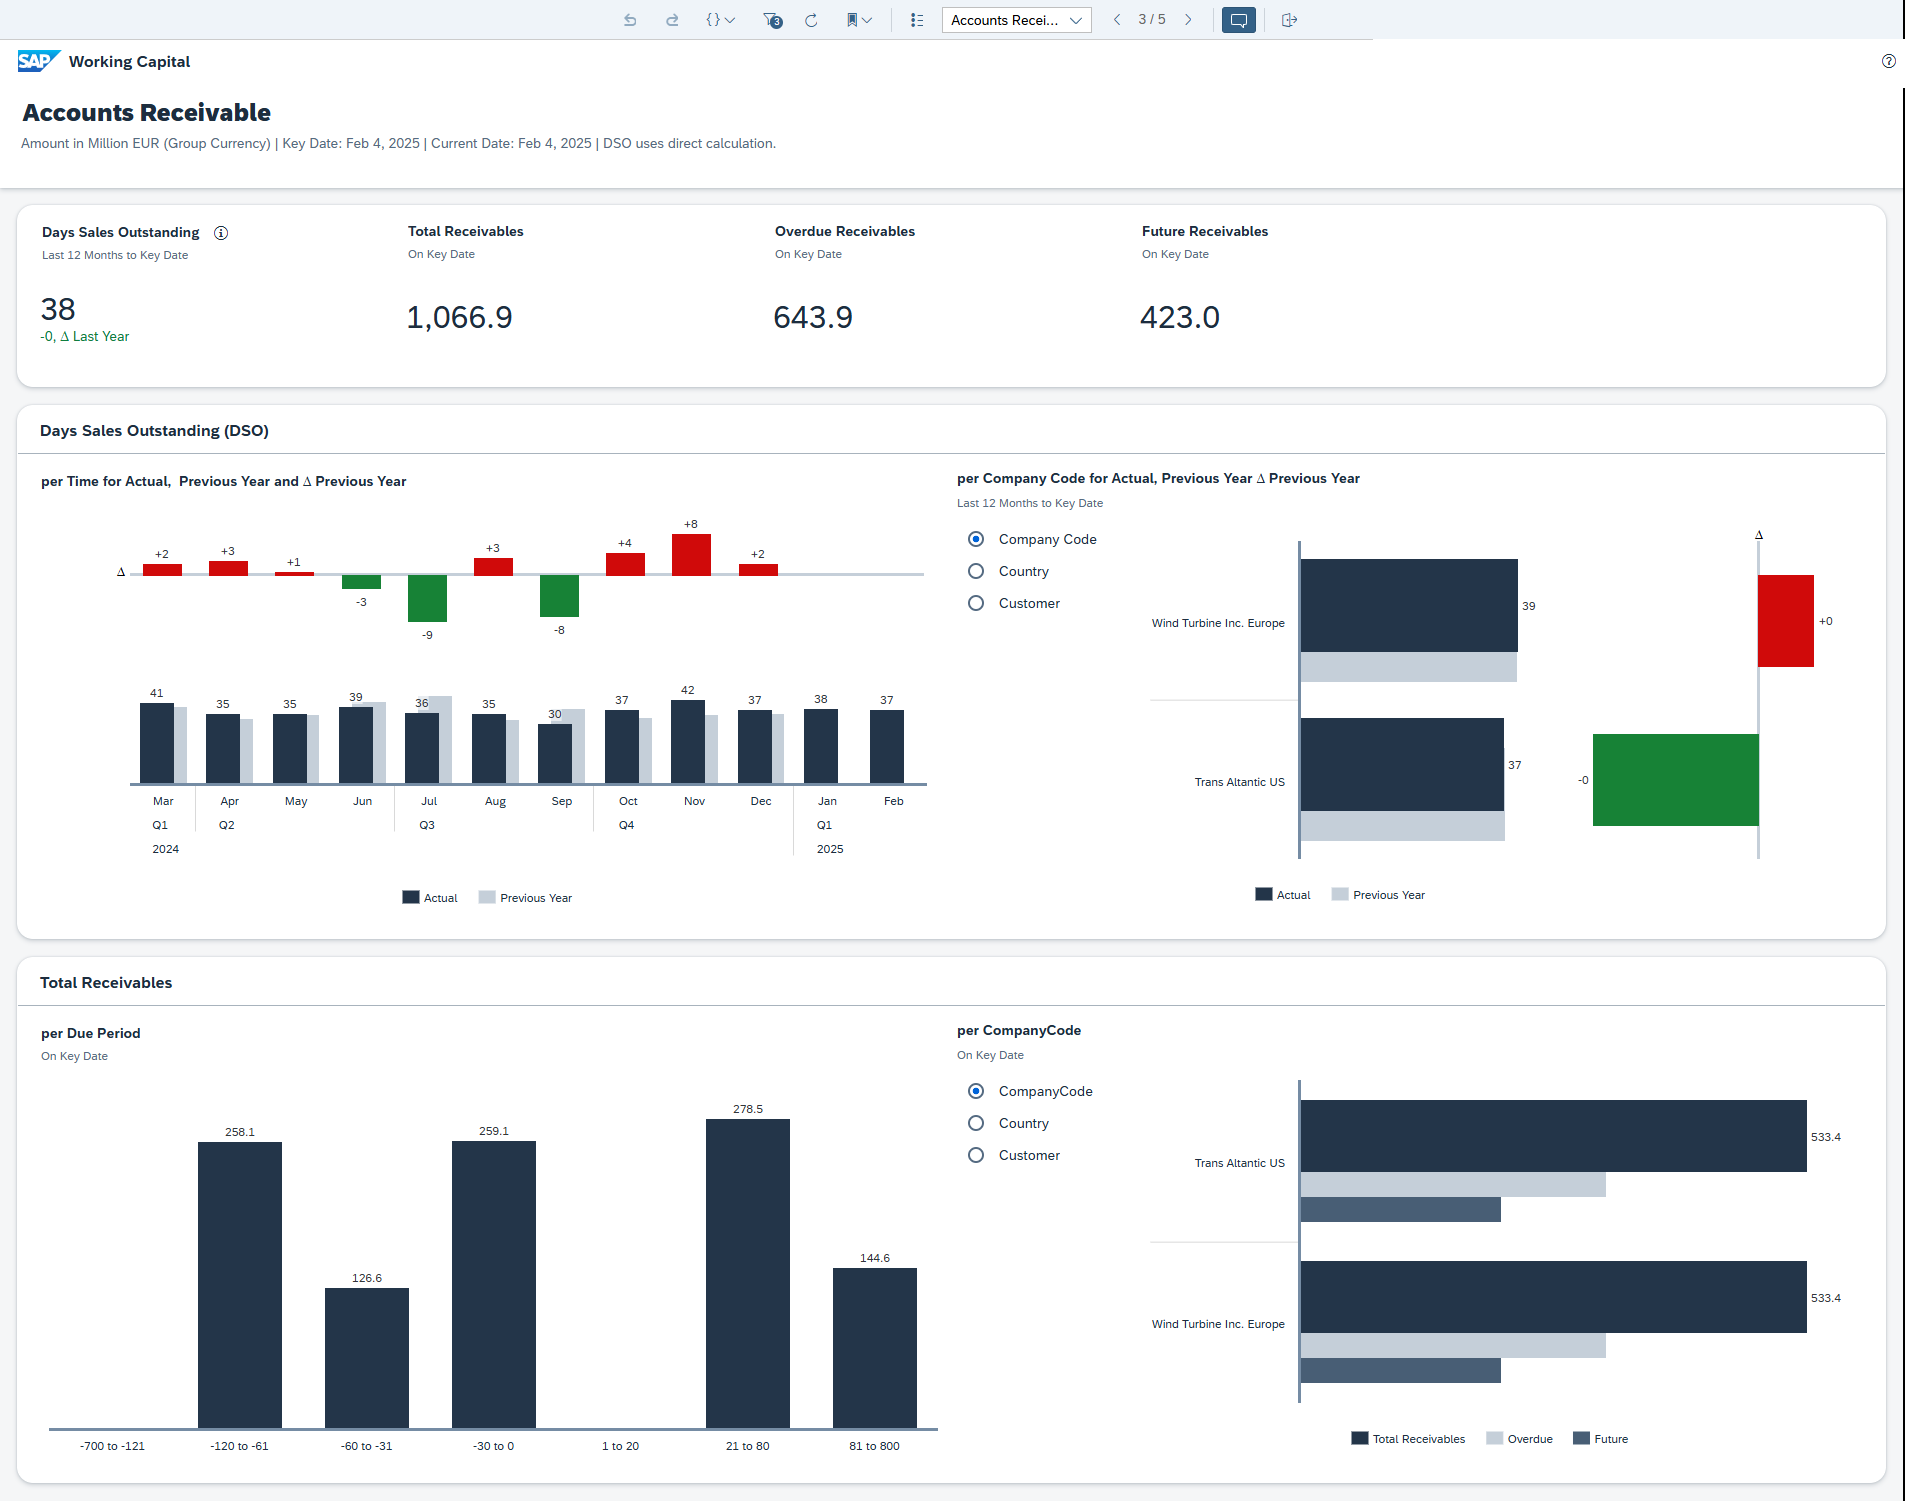
Accounts receivable page
I'd like to customise this further to include discounts, ageing and potentially something on credit rating breakdown of open AR.
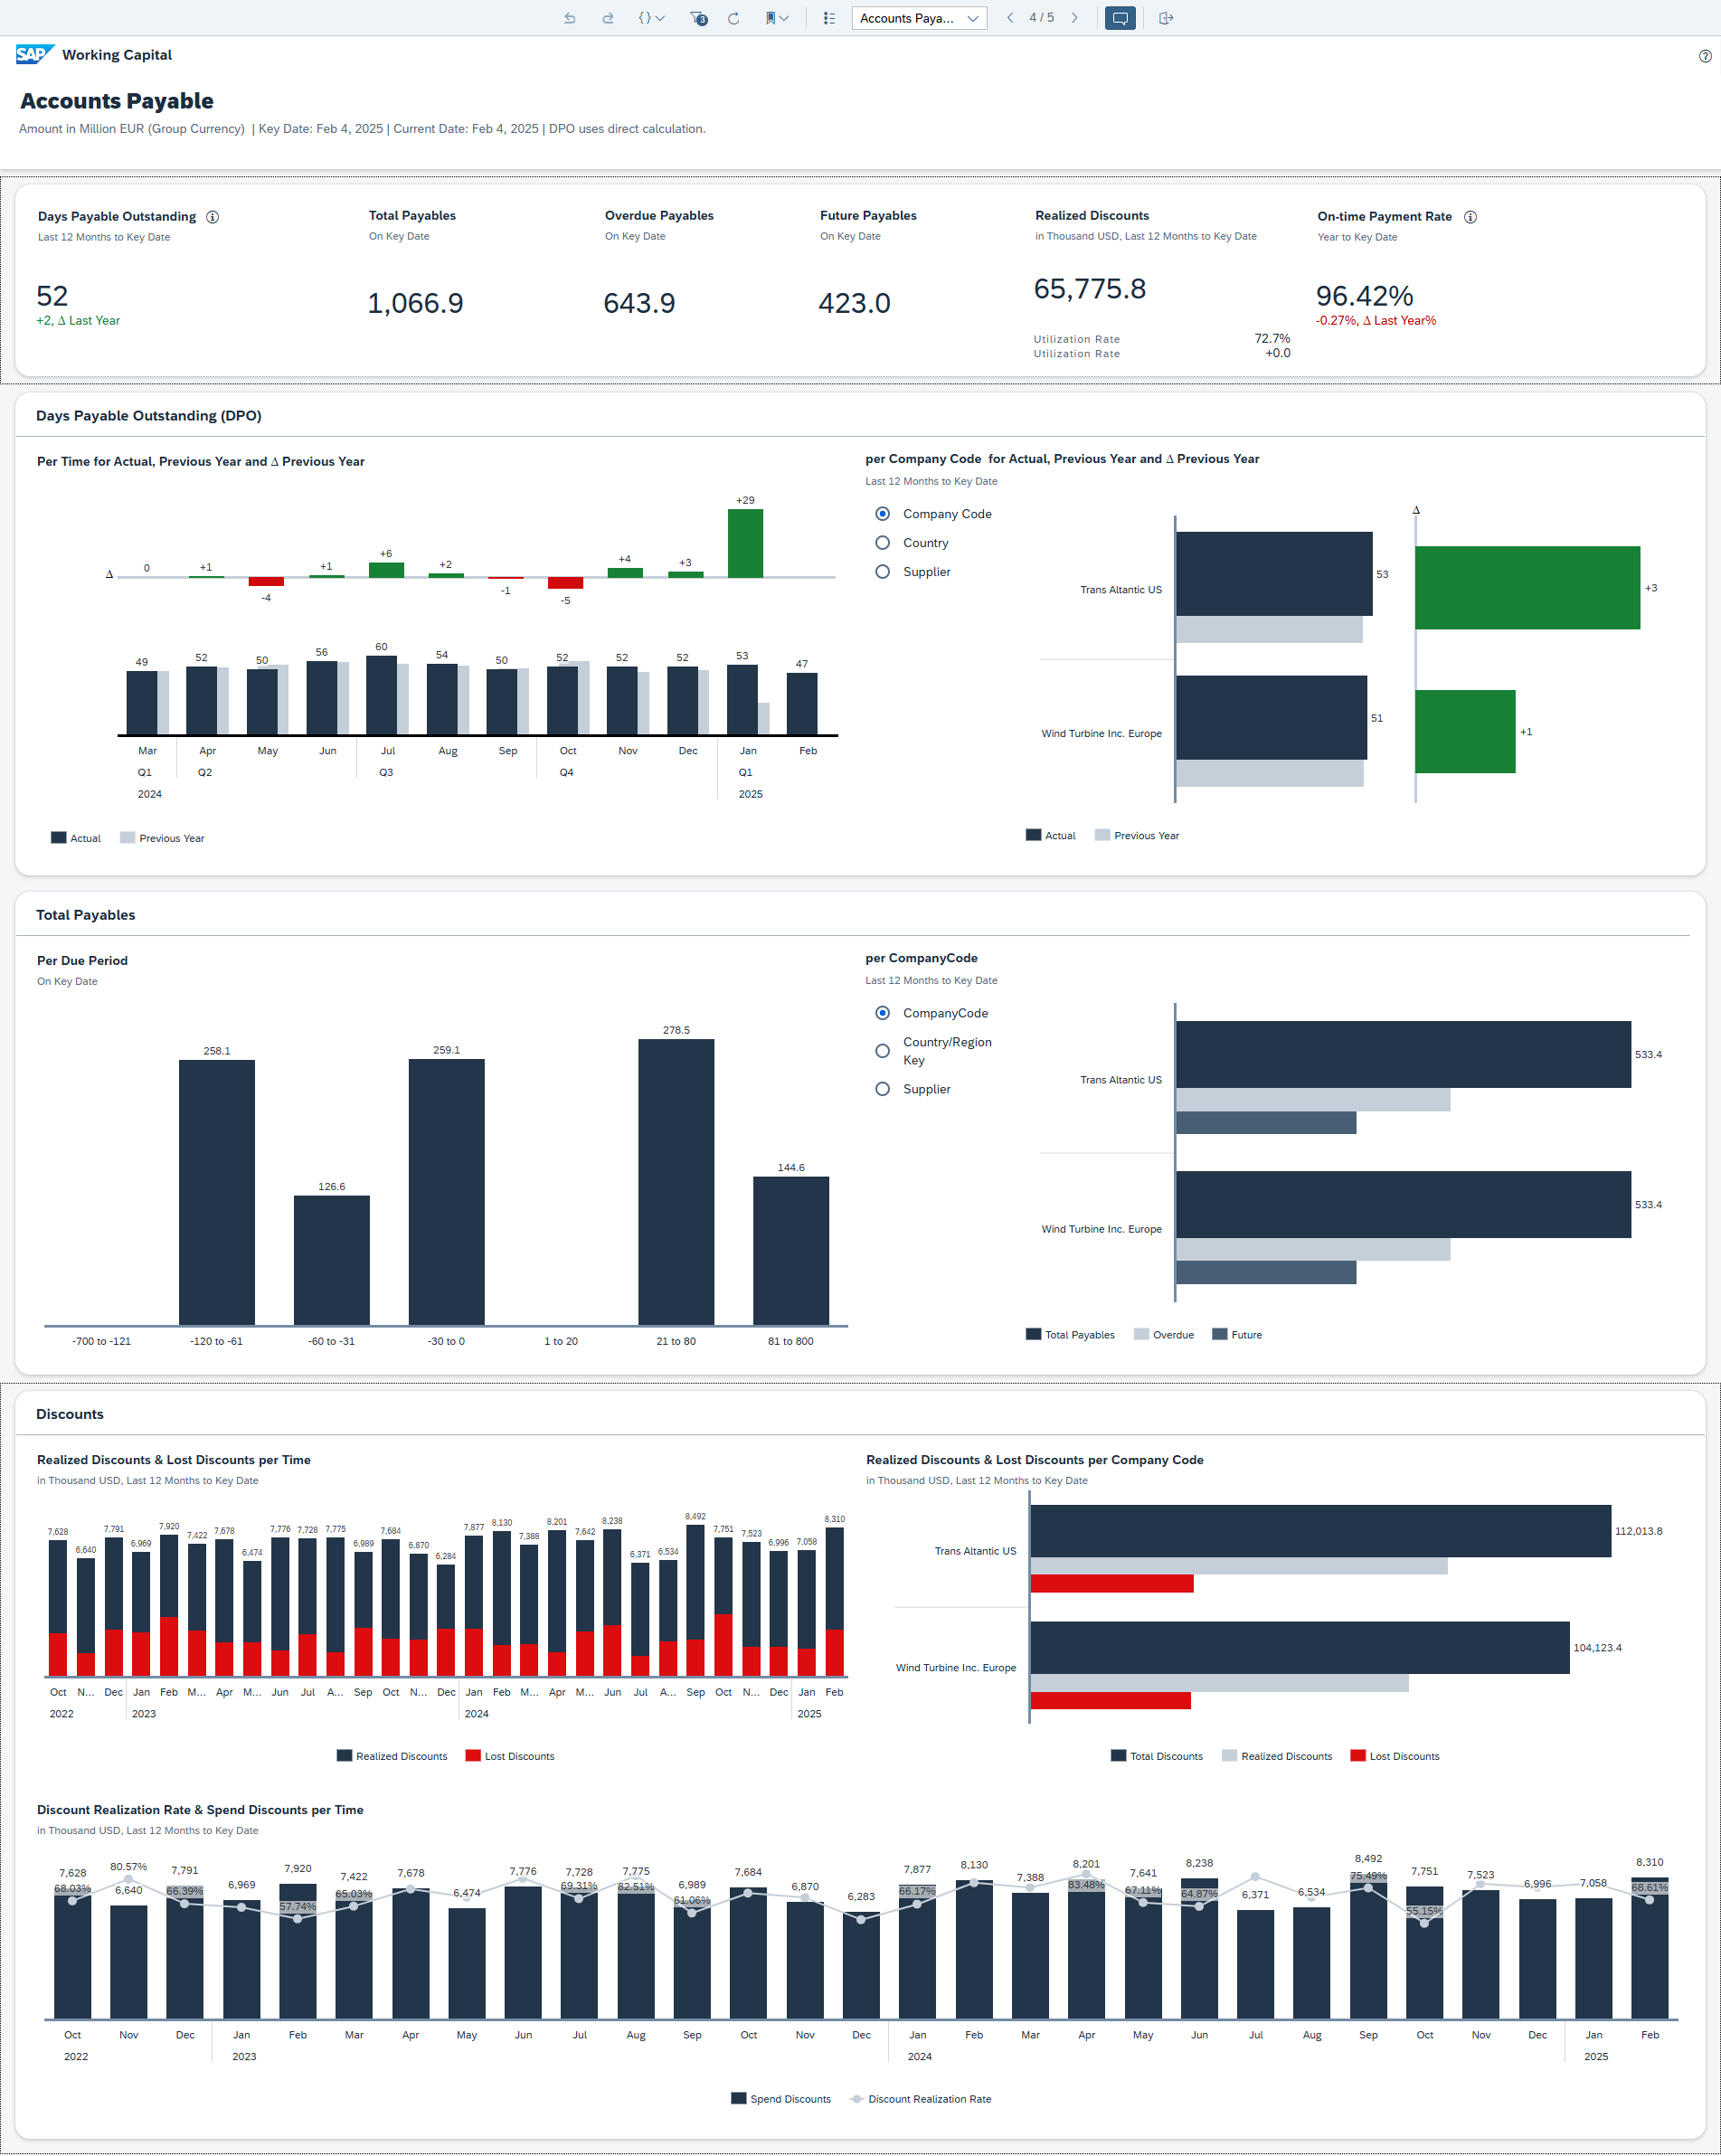
Accounts payable page
Excellent to see a few visualisations on discounts here. I would potentially want to customise this to add in an ageing analysis.
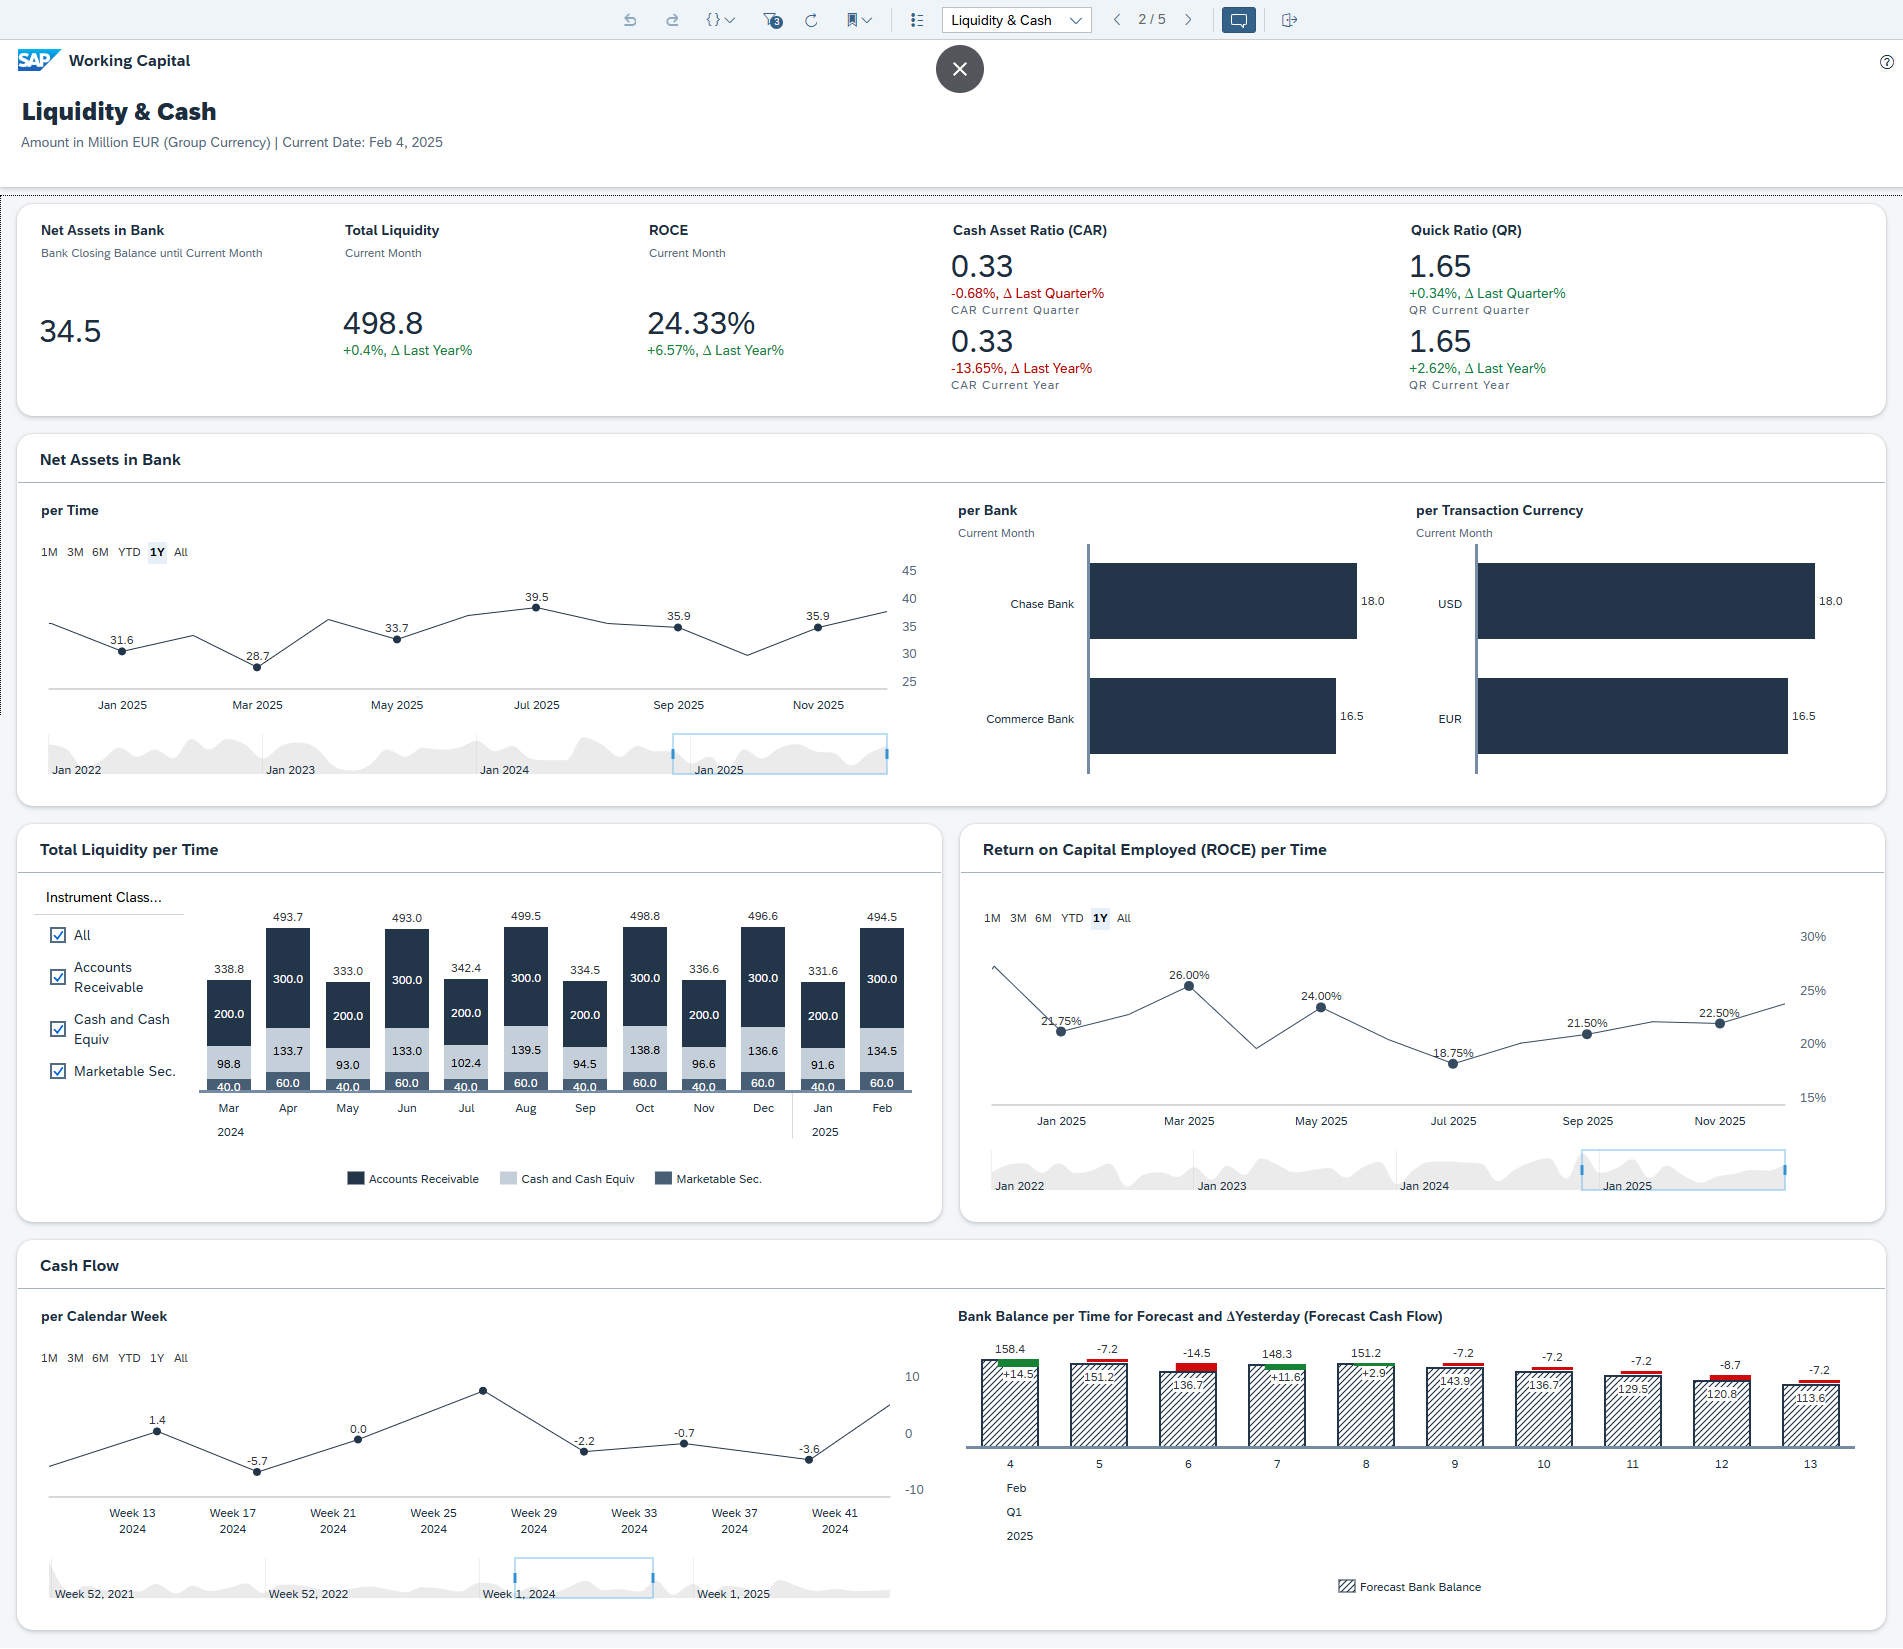
Liquidity and cash page
Great summary: liquidity breakdown, key relevant ratios like ROCE and cash flow.
Overall thoughts
The real benefit of this app is in three areas:
- It's part of BDC, delivered in SAP analytics cloud: so you can create country, region, group wide views regardless of source system
- It mixes the high level KPIs with various detailed breakdowns, which help a lot with interpretation
- It's customisable and extendable, including the addition of AI/ML generated data.
It would be hard to do a full criticism without using it as part of a real business, but my quick reaction is:
- I'd like to build something in to compare discounts vs. cost of loans
- Potentially interested to see something related to supply chain financing
- Would definitely want ageing views on AR and AP
Depending on the organisation there will be certain cash, inventory, AR or AP specific metrics important to that business that would be good to bring in.
BDC overview
My quick look at the intelligent working capital insights app glossed over a bunch of SAP systems. In this section, I'll briefly introduce and describe each:
Business Data Cloud can be considered as a software as a service platform oriented towards unification and governance of SAP data.
Several products sit under the umbrella of data cloud:
- Data Products for SAP line of business applications
- Business Warehouse
- Managed DataBricks
- Datasphere
- Analytics Cloud
- Intelligent Applications
The following SAP slide gives a great overview of BDC capabilities
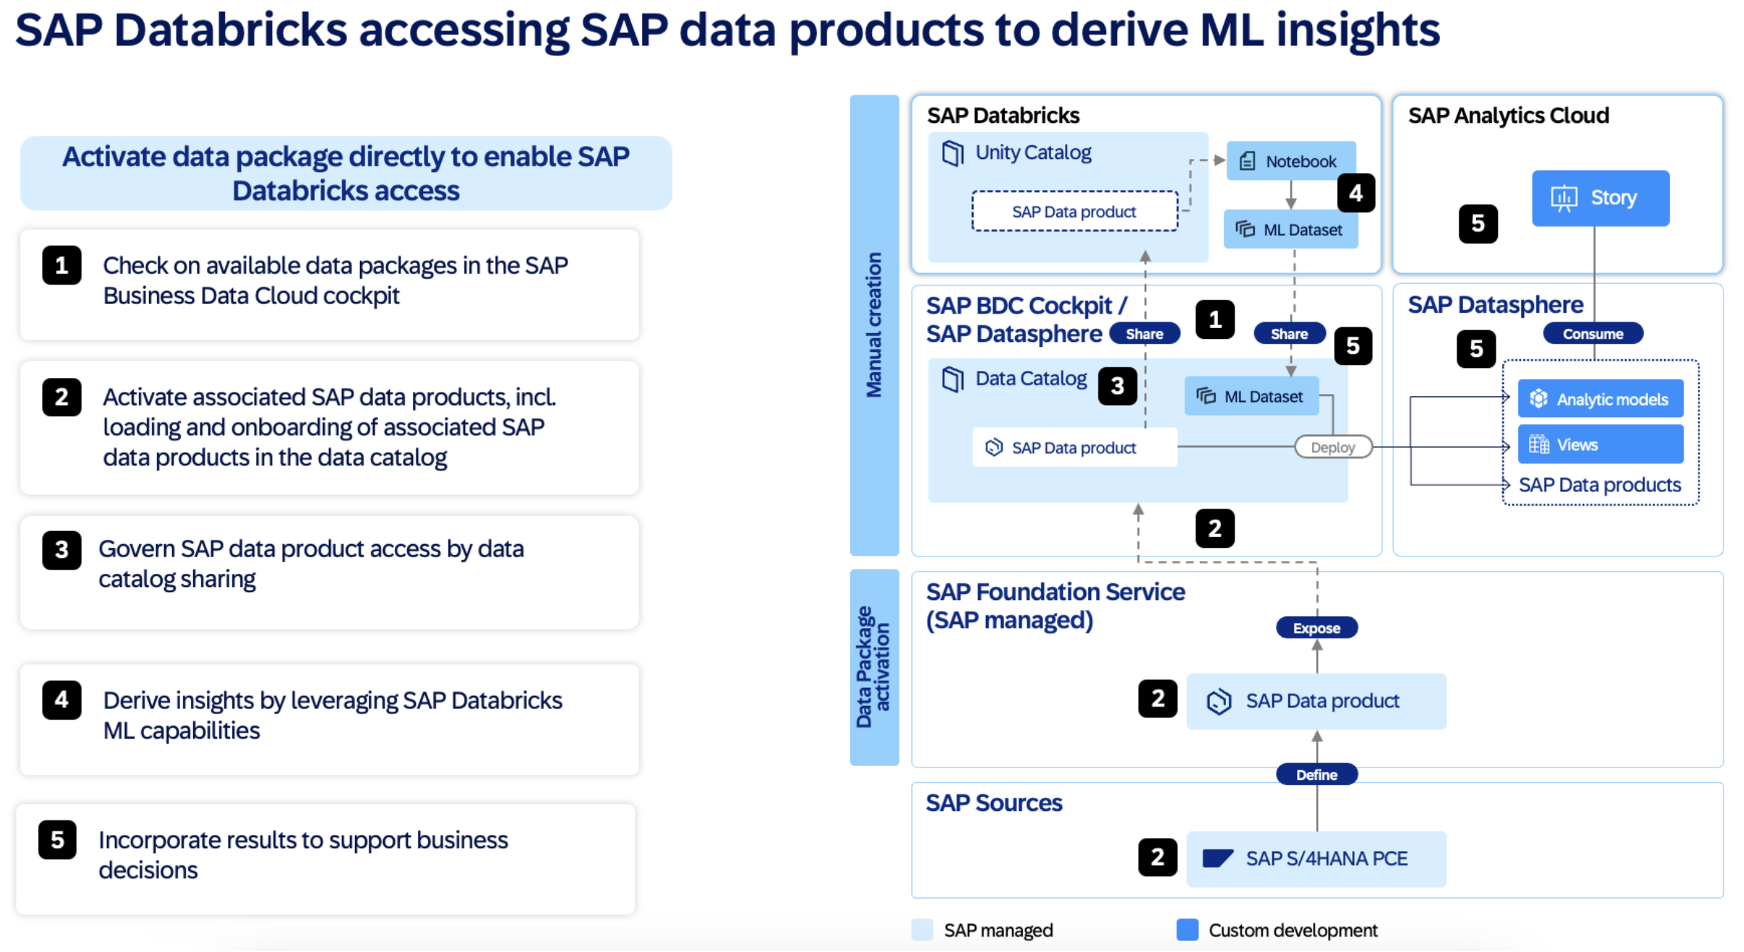
This shows how data products provide line of business (e.g. S/4HANA) data to BDC and Datasphere and how this can be manipulated in Databricks and consumed in SAP Analytics Cloud.
It's important to keep in mind that data products are fully managed and they automatically update with line of business system changes, so there's no interface overhead here.
I'll give a quick overview of each part of the architecture below.
Data products
- Curated set managed by from SAP
- Business context & semantic intact & fully governed
- BDC data products visualise KPIs from based on data from different S/4HANA financial areas related to **Finance Foundation for SAP S/4HANA and S/4HANA Cloud.
- Refined data set based on data ingested from an SAP solution
- SAP data products are created, delivered and managed by SAP
- Foundation for the SAP Business Data Cloud Intelligent Applications.
Databricks
A special edition of databricks lakehouse available in BDC
Features:
- Data engineering
- AI (pro-code dev of AI, ML)
- Analytics
- Fully integrated with SAP
- Access to data products w/out replication
- Combine SAP and external data, publish back to BDC
Example use cases:
- Automated forecasting, time-series with best algorithms, hyperparameters
- Fine-tuning an LLM: customise foundation models on your own data
- Exploratory data analysis: notebooks in multi-language work surface:
- Data science
- Visualisations
- Feature engineering
- ML model development
- Business intelligence:
- SQL editor to run optimised queries
- Create visualisation for BI
Datasphere
- Integrate, model, and share data from SAP and non-SAP sources.
- It's a cloud-based data management and analytics service
Datasphere finance foundation
- Broad foundation of SAP Datasphere data models
- A basis for a variety of financial reporting
Including
- G/L Account Line Items
- Actual/Plan Journal Entry Item
- Operational Accounting Document
- Journal Entry Operational View
- Corresponding master data models.
Models based on semantic tags make it easy to analyze and calculate various financial KPIs.
Profit & Loss:
The SAP Analytic Cloud Story Finance: P&L Statement (based on SAP Datasphere) is an example of how the foundation can be used.
It offers an overview of selected KPIs relevant to profit & loss, for instance Cost of Goods Sold (COGS), Net Profit, Operating Profit and Operating Expense. Year-over-Year, Plan vs. Actual comparisons and variances are also included.
Data Connectivity:
Based on live data access to SAP Datasphere (based on SAP S/4HANA or SAP S/4HANA Cloud).
SAP Analytics Cloud
- SAP's cloud based analytics solution.
Intelligent Applications
Pre-build applications from SAP.
For example, the working capital intelligent insights application discussed earlier.
- Intelligent app = premium offering exposed via BDC
- Streamline data analytics processes
- Comprehensive dashboards
- Facilitate data analysis
- Suggest viable action
- Use AI where possible
- Installing an intelligent app also installs its data products
AI in Working Capital Management
The above section covered Databricks, which can be used to integrate AI with SAP line of business data.
However, any AI / ML and data engineering product stack can be used to apply these capabilities to working capital data.
AI/ML models and algorithms can be run on the detailed data that lies underneath working capital KPIs to do various things:
- Predictive analysis on DSO, DPO
- Analysis of A/R and automation of collection activities.
- Scenario analysis
- Stress-testing working capital under market changes
Appendix 1: data products
One of the themes of this article is the wide range of data needed to calculate and interpret working capital.
We've seen that it's difficult to calculate working capital KPIs in a single system.
External data warehouses are a popular alternative, however these generally require a range of effort to manage interfaces, replication, data model design etc.
The SAP data products we talked about are designed to be mostly SAP managed ways to get working capital data from source systems to the app. SAP published the list of data products used in this app. There are 35 in the current version. This list gives a good indication of the scope of data we are talking about for working capital calculation:
- BillableControl | Billable Control
- BusinessArea | Business Area
- CashFlow | Cash Flow
- Company | Company
- CompanyCode | Company Code
- ConsolidationChartOfAccounts | Consolidation Chart Of Accounts
- ConsolidationSubitem | Consolidation Subitem
- ConsolidationUnit | Consolidation Unit
- ControllingArea | Controlling Area
- ControllingObject | Controlling Object
- CostAnalysisResource | Cost Analysis Resource
- CostCenter | Cost Center
- CostCenterActivityType | Cost Center Activity Type
- CountryRegion | Country / Region
- Customer | Customer
- EntryViewJournalEntry | Entry View Journal Entry
- FinancialPlanningEntryItem | Financial Planning Entry Item
- FiscalYear | Fiscal Year
- FunctionalArea | Functional Area
- GeneralLedgerAccount | General Ledger Account
- HANACurrency | HANA Currency
- HouseBank | House Bank
- InternalOrder | Internal Order
- JournalEntryCodes | Journal Entry Codes
- JournalEntryHeader | Journal Entry Header
- JournalEntryItemCodes | Journal Entry Item Codes
- Ledger | Ledger
- OperatingConcern | Operating Concern
- Plant | Plant
- Product | Product
- ProfitCenter | Profit Center
- PurchasingOrganization | Purchasing Organization
- SalesTaxType | Sales Tax Type
- Segment | Segment
- Supplier | Supplier
Share, comment/discuss
Share to: LinkedIn, X